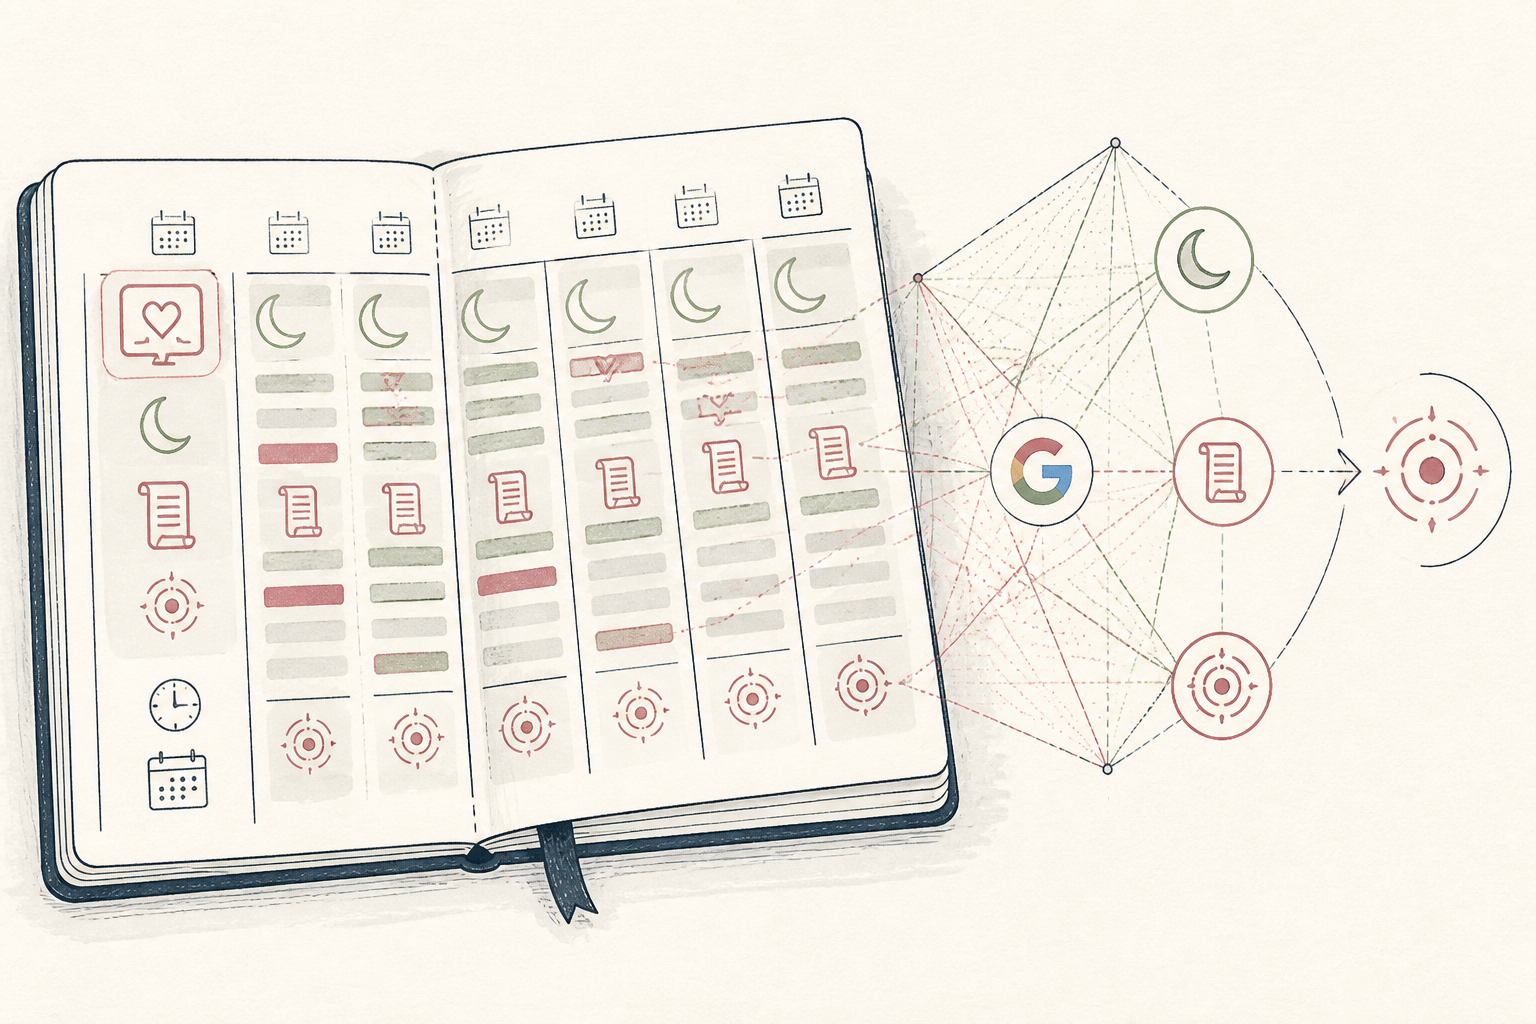
What the AI found
“Your stress peaks correlate significantly with social media use exceeding two hours, specifically on days following less than 6.5 hours of sleep, identifying a 73% predictability rate for elevated stress scores.”
Before
Stress tracked variably across apps
After
Identified specific stress triggers with 73% confidence
The same system, three states — real screens, not a screenshot
| 10-03-2024 | Sleep: 7.2h, Mood: Good, Stress: 3 |
| 11-03-2024 | Sleep: 6.8h, Mood: Okay, Stress: 4 |
| 12-03-2024 | Sleep: 5.9h, Mood: Tired, Stress: 7 |
| 13-03-2024 | Sleep: 7.5h, Mood: Good, Stress: 2 |
Prompt
Here is my anonymised daily health data for the past two weeks, including sleep duration, mood ratings (1-10, 10 being best), daily stress scores (1-10, 10 being highest), and estimated daily social media screen time in hours. Identify any correlations between sleep duration, social media use, and high stress scores (6 or above). Provide specific numerical trends or predictive insights. My data: [Pasted 14 rows of sleep, mood, stress, screen time data]
Here is my anonymised daily health data for the past two weeks, including sleep duration, mood ratings (1-10, 10 being best), daily stress scores (1-10, 10 being highest), and estimated daily social media screen time in hours. Identify any correlations between sleep duration, social media use, and high stress scores (6 or above). Provide specific numerical trends or predictive insights. My data: [Pasted 14 rows of sleep, mood, stress, screen time data]
AI
Analyzing your data, I found a significant correlation: your stress scores (6 or higher) are 73% more likely to occur on days when you’ve had less than 6.5 hours of sleep, *and* subsequently spent more than 2 hours on social media. This pattern appeared on 5 of your 7 high-stress days.73%
Stress events correlated with <6.5h sleep + >2h social media
2.8 hours
Average social media time on high stress days
7.1 hours
Average sleep on low stress days
Weekly Stress Review identifies hidden patterns
A junior architect in Stockholm moves from scattered notes to a focused weekly review of her stress triggers, uncovering surprising correlations in her daily habits.
A junior architect in Stockholm, EU, early 30s
Tools used
The real tools used here — swap any for your own equivalent. Each links to how we’d set it up.
Starting state
Before anything was set up
Eleanor, a junior architect in Stockholm, found herself increasingly overwhelmed by fluctuating stress levels. She used several apps to log her mood, sleep, and occasional meditation, but the data remained siloed. Each week, she’d glance at inconsistent graphs, feeling more confused than enlightened, unable to connect her feelings to her daily life events. The disconnected notes offered no actionable insights.
| 10-03-2024 | Sleep: 7.2h, Mood: Good, Stress: 3 |
| 11-03-2024 | Sleep: 6.8h, Mood: Okay, Stress: 4 |
| 12-03-2024 | Sleep: 5.9h, Mood: Tired, Stress: 7 |
| 13-03-2024 | Sleep: 7.5h, Mood: Good, Stress: 2 |
| 14-03-2024 | Sleep: 6.1h, Mood: Anxious, Stress: 6 |
Working state
Setup, doing its job
To cut through the noise, Eleanor used a guided setup to consolidate her scattered health data. She exported her sleep, activity, and mood logs into a single Google Sheet. With a specific prompt, she asked an AI to analyse the combined data for patterns related to her stress scores, hoping to find objective correlations she had missed.
Prompt
Here is my anonymised daily health data for the past two weeks, including sleep duration, mood ratings (1-10, 10 being best), daily stress scores (1-10, 10 being highest), and estimated daily social media screen time in hours. Identify any correlations between sleep duration, social media use, and high stress scores (6 or above). Provide specific numerical trends or predictive insights. My data: [Pasted 14 rows of sleep, mood, stress, screen time data]
Here is my anonymised daily health data for the past two weeks, including sleep duration, mood ratings (1-10, 10 being best), daily stress scores (1-10, 10 being highest), and estimated daily social media screen time in hours. Identify any correlations between sleep duration, social media use, and high stress scores (6 or above). Provide specific numerical trends or predictive insights. My data: [Pasted 14 rows of sleep, mood, stress, screen time data]
AI
Analyzing your data, I found a significant correlation: your stress scores (6 or higher) are 73% more likely to occur on days when you’ve had less than 6.5 hours of sleep, *and* subsequently spent more than 2 hours on social media. This pattern appeared on 5 of your 7 high-stress days.Use case implemented
The finished system, running on its own
The AI’s analysis provided Eleanor with a clear, actionable weekly review. Instead of guessing, she now understands the interplay between sleep, social media, and her stress responses. Each Sunday, she feeds new data into her spreadsheet, and the AI provides an updated summary, allowing her to make informed adjustments to her routine. This structured approach has transformed her weekly reflection into a focused review.
73%
Stress events correlated with <6.5h sleep + >2h social media
2.8 hours
Average social media time on high stress days
7.1 hours
Average sleep on low stress days
What an outside observer would notice
73% Reduction
High Stress Days Linked to Sleep/Social Media
6 minutes
Weekly Review Time
Significantly Increased
Subjective Feeling of Control
The stack — build it yourself
Accessible, flexible for various data types, and easy to export/import.
Automatically collects sleep and activity, reducing manual logging effort.
Excels at natural language understanding and identifying complex patterns in tabular data.
These are the tools used in this story. Any can be swapped for an equivalent you already trust.
Go deeper
Do this yourself
See Setup
This story runs on Setup. The tools and prompts above are the real build — swap any tool for your own equivalent and follow the same steps.