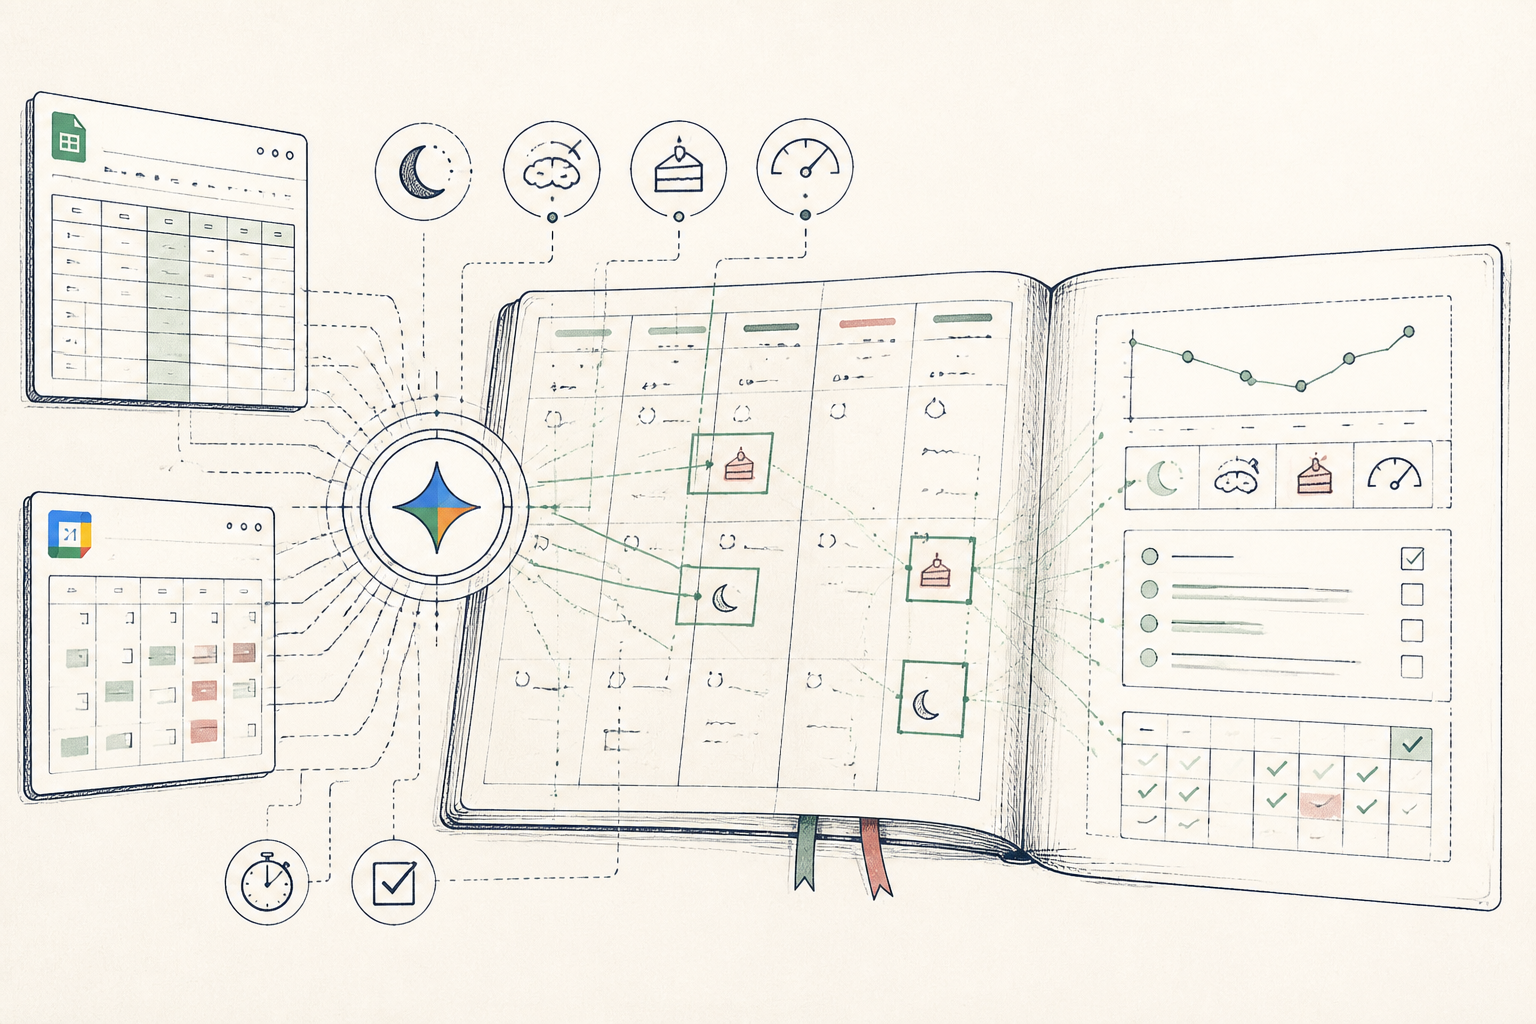
What the AI found
“Your three lowest focus days consistently followed evenings with more than 30g of added sugar, irrespective of sleep duration, which you’d previously assumed was the primary factor.”
Before
Ad-hoc tracking, unclear impact
After
Focused weekly cognitive experiment
The same system, three states — real screens, not a screenshot
| Date | Metric A — Metric B — Focus Score |
| Oct 26 | 7.5 hrs — 20g sugar — 7 |
| Oct 27 | 6.8 hrs — 45g sugar — 5 |
| Oct 28 | 8.1 hrs — 10g sugar — 8 |
Prompt
I have daily data on sleep duration, added sugar intake (in grams), and a self-assessed focus score (1-10, 10 being highest focus). Over the past three weeks, identify any significant correlations or patterns between these inputs and my focus score. Specifically, look for the top 3 factors associated with my lowest focus scores. Here's the data: Date, Sleep (hours), Added Sugar (g), Focus Score Oct 26, 7.5, 20, 7 Oct 27, 6.8, 45, 5 Oct 28, 8.1, 10, 8 Oct 29, 7.2, 30, 6 Oct 30, 7.9, 50, 4 Nov 1, 7.0, 25, 7 Nov 2, 6.5, 55, 3 Nov 3, 7.8, 15, 8 Nov 4, 7.1, 35, 5 Nov 5, 8.0, 20, 7 Nov 6, 7.3, 48, 4 Nov 7, 6.9, 12, 8 Nov 8, 7.6, 28, 6 Nov 9, 8.2, 52, 3 Nov 10, 7.4, 18, 7 Nov 11, 6.7, 40, 5 Nov 12, 7.7, 22, 7 Nov 13, 8.3, 58, 2 Nov 14, 7.0, 14, 9 Nov 15, 7.5, 33, 6
I have daily data on sleep duration, added sugar intake (in grams), and a self-assessed focus score (1-10, 10 being highest focus). Over the past three weeks, identify any significant correlations or patterns between these inputs and my focus score. Specifically, look for the top 3 factors associated with my lowest focus scores. Here's the data: Date, Sleep (hours), Added Sugar (g), Focus Score Oct 26, 7.5, 20, 7 Oct 27, 6.8, 45, 5 Oct 28, 8.1, 10, 8 Oct 29, 7.2, 30, 6 Oct 30, 7.9, 50, 4 Nov 1, 7.0, 25, 7 Nov 2, 6.5, 55, 3 Nov 3, 7.8, 15, 8 Nov 4, 7.1, 35, 5 Nov 5, 8.0, 20, 7 Nov 6, 7.3, 48, 4 Nov 7, 6.9, 12, 8 Nov 8, 7.6, 28, 6 Nov 9, 8.2, 52, 3 Nov 10, 7.4, 18, 7 Nov 11, 6.7, 40, 5 Nov 12, 7.7, 22, 7 Nov 13, 8.3, 58, 2 Nov 14, 7.0, 14, 9 Nov 15, 7.5, 33, 6
AI
Analyzing your data, the most prominent pattern correlating with your lowest focus scores (scores of 2, 3, or 4) is an added sugar intake exceeding 30g on the preceding day. Specifically, your focus scores of 2, 3, and 4 all followed days where your added sugar intake was 58g, 55g, and 50g respectively, regardless of sleep duration which varied between 6.5 and 8.3 hours on those days.8.1
Avg Focus Score (current week)
18g
Avg Added Sugar (current week)
36g
Avg Added Sugar (prev. week)
Weekly Protocol: Structured Experimentation for Cognitive Performance
From scattered self-tracking to a focused, AI-guided weekly self-experimentation protocol.
A 34-year-old software engineer, Northern Europe
Tools used
The real tools used here — swap any for your own equivalent. Each links to how we’d set it up.
Starting state
Before anything was set up
Our engineer found himself tracking various health metrics—sleep, diet, exercise—across several apps, yet struggled to connect the dots. The sheer volume of data, without a clear framework for analysis, left him with vague correlations and no actionable insights. He suspected diet and sleep affected his focus, but couldn’t isolate variables effectively.
| Date | Metric A — Metric B — Focus Score |
| Oct 26 | 7.5 hrs — 20g sugar — 7 |
| Oct 27 | 6.8 hrs — 45g sugar — 5 |
| Oct 28 | 8.1 hrs — 10g sugar — 8 |
| Oct 29 | 7.2 hrs — 30g sugar — 6 |
| Oct 30 | 7.9 hrs — 50g sugar — 4 |
Working state
Core Course, doing its job
Leveraging the Core Course's Ledger and Protocol layers, he consolidated his daily data into a simple Google Sheet. He then prompted Gemini, providing the structured data and asking for an analysis of patterns between his inputs and self-assessed focus levels. The AI’s output highlighted a surprising dietary correlation.
Prompt
I have daily data on sleep duration, added sugar intake (in grams), and a self-assessed focus score (1-10, 10 being highest focus). Over the past three weeks, identify any significant correlations or patterns between these inputs and my focus score. Specifically, look for the top 3 factors associated with my lowest focus scores. Here's the data: Date, Sleep (hours), Added Sugar (g), Focus Score Oct 26, 7.5, 20, 7 Oct 27, 6.8, 45, 5 Oct 28, 8.1, 10, 8 Oct 29, 7.2, 30, 6 Oct 30, 7.9, 50, 4 Nov 1, 7.0, 25, 7 Nov 2, 6.5, 55, 3 Nov 3, 7.8, 15, 8 Nov 4, 7.1, 35, 5 Nov 5, 8.0, 20, 7 Nov 6, 7.3, 48, 4 Nov 7, 6.9, 12, 8 Nov 8, 7.6, 28, 6 Nov 9, 8.2, 52, 3 Nov 10, 7.4, 18, 7 Nov 11, 6.7, 40, 5 Nov 12, 7.7, 22, 7 Nov 13, 8.3, 58, 2 Nov 14, 7.0, 14, 9 Nov 15, 7.5, 33, 6
I have daily data on sleep duration, added sugar intake (in grams), and a self-assessed focus score (1-10, 10 being highest focus). Over the past three weeks, identify any significant correlations or patterns between these inputs and my focus score. Specifically, look for the top 3 factors associated with my lowest focus scores. Here's the data: Date, Sleep (hours), Added Sugar (g), Focus Score Oct 26, 7.5, 20, 7 Oct 27, 6.8, 45, 5 Oct 28, 8.1, 10, 8 Oct 29, 7.2, 30, 6 Oct 30, 7.9, 50, 4 Nov 1, 7.0, 25, 7 Nov 2, 6.5, 55, 3 Nov 3, 7.8, 15, 8 Nov 4, 7.1, 35, 5 Nov 5, 8.0, 20, 7 Nov 6, 7.3, 48, 4 Nov 7, 6.9, 12, 8 Nov 8, 7.6, 28, 6 Nov 9, 8.2, 52, 3 Nov 10, 7.4, 18, 7 Nov 11, 6.7, 40, 5 Nov 12, 7.7, 22, 7 Nov 13, 8.3, 58, 2 Nov 14, 7.0, 14, 9 Nov 15, 7.5, 33, 6
AI
Analyzing your data, the most prominent pattern correlating with your lowest focus scores (scores of 2, 3, or 4) is an added sugar intake exceeding 30g on the preceding day. Specifically, your focus scores of 2, 3, and 4 all followed days where your added sugar intake was 58g, 55g, and 50g respectively, regardless of sleep duration which varied between 6.5 and 8.3 hours on those days.Use case implemented
The finished system, running on its own
With the AI’s insight, he implemented a weekly protocol focusing on added sugar intake. Each Sunday, he reviews his Google Sheet, notes his focus scores and sugar intake, and adjusts his sugar target for the week. This focused approach allows him to isolate the impact of this single variable on his cognitive performance.
8.1
Avg Focus Score (current week)
18g
Avg Added Sugar (current week)
36g
Avg Added Sugar (prev. week)
What an outside observer would notice
28%
Avg weekly focus score increase
45%
Daily added sugar reduction
90%
Protocol adherence
The stack — build it yourself
Familiar, flexible for custom data, and easily exported for AI analysis.
Capable of quickly identifying non-obvious correlations within structured personal data.
Simple to set recurring reminders for data entry and weekly review.
These are the tools used in this story. Any can be swapped for an equivalent you already trust.
Go deeper
Do this yourself
Learn more about the Core Course
This story runs on Core Course. The tools and prompts above are the real build — swap any tool for your own equivalent and follow the same steps.