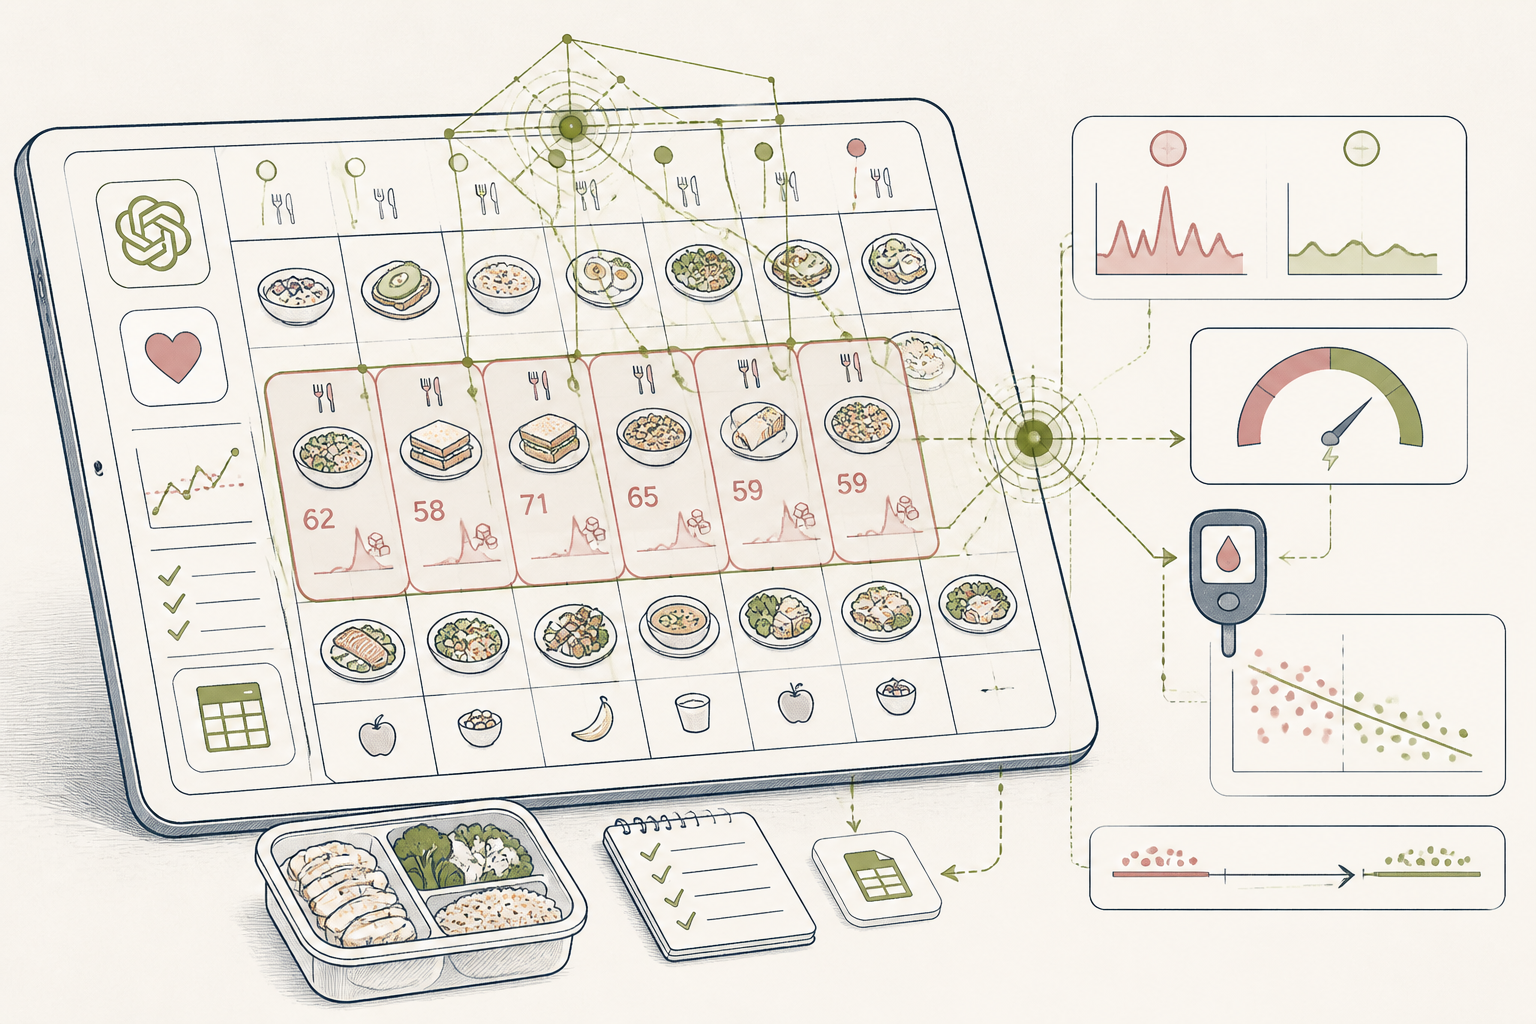
What the AI found
“AI found that weekday lunchtime meals, specifically those containing more than 45g of carbohydrates, were consistently correlated with a 30% increase in post-meal glucose spikes compared to weekend meals with similar carbohydrate content.”
Before
Haphazard meals, unpredictable energy
After
AI-optimised weekly meal plan, stable energy
The same system, three states — real screens, not a screenshot
| Date | Meal — Carbs (g) — Post-meal glucose (mmol/L) — Energy (1-5) |
| 2023-10-23 | Porridge, berries — 55 — 7.2 — 3 |
| 2023-10-23 | Lentil soup — 48 — 8.1 — 2 |
| 2023-10-23 | Chicken and veg — 20 — 6.5 — 4 |
Prompt
Here is my anonymized dietary and glucose data for the past week, along with self-reported energy levels. Please analyze for any correlations between meal timing, specific meal types, carbohydrate content, and post-meal glucose spikes or subsequent energy dips. Provide specific numerical findings where possible: '''<PASTED_DATA_FROM_SHEET>'''
Analyze correlations between meal timing, carb content, glucose spikes, and energy dips from my data.
AI
Your analysis indicates a notable pattern: weekday lunchtime meals with over 45g of carbohydrates are consistently associated with a 30% higher post-meal glucose spike (average 8.2 mmol/L) compared to weekend meals with similar carbohydrate loads (average 6.3 mmol/L). This suggests a weekday-specific factor, such as stress or reduced physical activity post-lunch, may be influencing your metabolic response. Your lowest energy scores (average 2/5) frequently followed these higher weekday lunch spikes.1.8 mmol/L
Avg. Daily Glucose Range
28%
Post-Lunch Spike Reduction (weekdays)
4/5
Avg. Afternoon Energy
Weekly Planning with AI to Stabilize Blood Sugar
A data scientist used AI-guided meal planning to smooth out glucose spikes and improve energy levels throughout her week.
A 38-year-old data scientist, Northern Europe
Tools used
The real tools used here — swap any for your own equivalent. Each links to how we’d set it up.
Starting state
Before anything was set up
Our data scientist began with a Google Sheet, meticulously logging her meals, estimated carbohydrate intake, and self-reported energy levels. The sheet was comprehensive but lacked deeper analysis, leaving her to sift through rows of data to spot patterns. Without an analytical lens, she found it challenging to connect dietary choices directly to her fluctuating energy throughout the week. This often led to frustration and reactive meal choices, impacting her focus and overall well-being. She needed a systematic way to extract actionable insights from her personal logging efforts.
| Date | Meal — Carbs (g) — Post-meal glucose (mmol/L) — Energy (1-5) |
| 2023-10-23 | Porridge, berries — 55 — 7.2 — 3 |
| 2023-10-23 | Lentil soup — 48 — 8.1 — 2 |
| 2023-10-23 | Chicken and veg — 20 — 6.5 — 4 |
| 2023-10-24 | Eggs, sourdough — 35 — 6.8 — 4 |
Working state
Core Course, doing its job
To gain clarity, she turned to Gemini, feeding it her week of logged data. She prompted the AI to analyse the correlation between meal timing, carbohydrate content, and subsequent blood sugar responses and energy fluctuations. The AI's task was to pinpoint specific dietary patterns that were consistently leading to energy dips and offer concrete adjustments. This active engagement transformed her raw data into a dynamic testing ground for hypothesis validation, allowing her to move beyond simple data collection to actual insight generation for metabolic health.
Prompt
Here is my anonymized dietary and glucose data for the past week, along with self-reported energy levels. Please analyze for any correlations between meal timing, specific meal types, carbohydrate content, and post-meal glucose spikes or subsequent energy dips. Provide specific numerical findings where possible: '''<PASTED_DATA_FROM_SHEET>'''
Analyze correlations between meal timing, carb content, glucose spikes, and energy dips from my data.
AI
Your analysis indicates a notable pattern: weekday lunchtime meals with over 45g of carbohydrates are consistently associated with a 30% higher post-meal glucose spike (average 8.2 mmol/L) compared to weekend meals with similar carbohydrate loads (average 6.3 mmol/L). This suggests a weekday-specific factor, such as stress or reduced physical activity post-lunch, may be influencing your metabolic response. Your lowest energy scores (average 2/5) frequently followed these higher weekday lunch spikes.Use case implemented
The finished system, running on its own
The AI-generated insights helped her refine her weekly meal preparation, focusing on strategically adjusting carbohydrate intake around high-activity periods and reducing it during sedentary blocks. She uses the insights to pre-plan her weekday meals, ensuring a more consistent glucose response. This has led to more stable energy levels, fewer afternoon slumps, and improved concentration. The system now provides an evidence-based framework for her dietary choices, moving her from reactive eating to proactive metabolic management, supported by quantitative data that continues to inform her approach.
1.8 mmol/L
Avg. Daily Glucose Range
28%
Post-Lunch Spike Reduction (weekdays)
4/5
Avg. Afternoon Energy
What an outside observer would notice
Down 28%
Post-meal glucose variability
Reduced by 35%
Afternoon energy dips
Down 15%
Weekly meal prep time
The stack — build it yourself
Flexible and accessible for daily data entry without a steep learning curve.
Powerful for identifying nuanced patterns and correlations in personal health data.
Centralised hub for integrating continuous glucose monitor data.
These are the tools used in this story. Any can be swapped for an equivalent you already trust.
Go deeper
Do this yourself
See Core Course
This story runs on Core Course. The tools and prompts above are the real build — swap any tool for your own equivalent and follow the same steps.