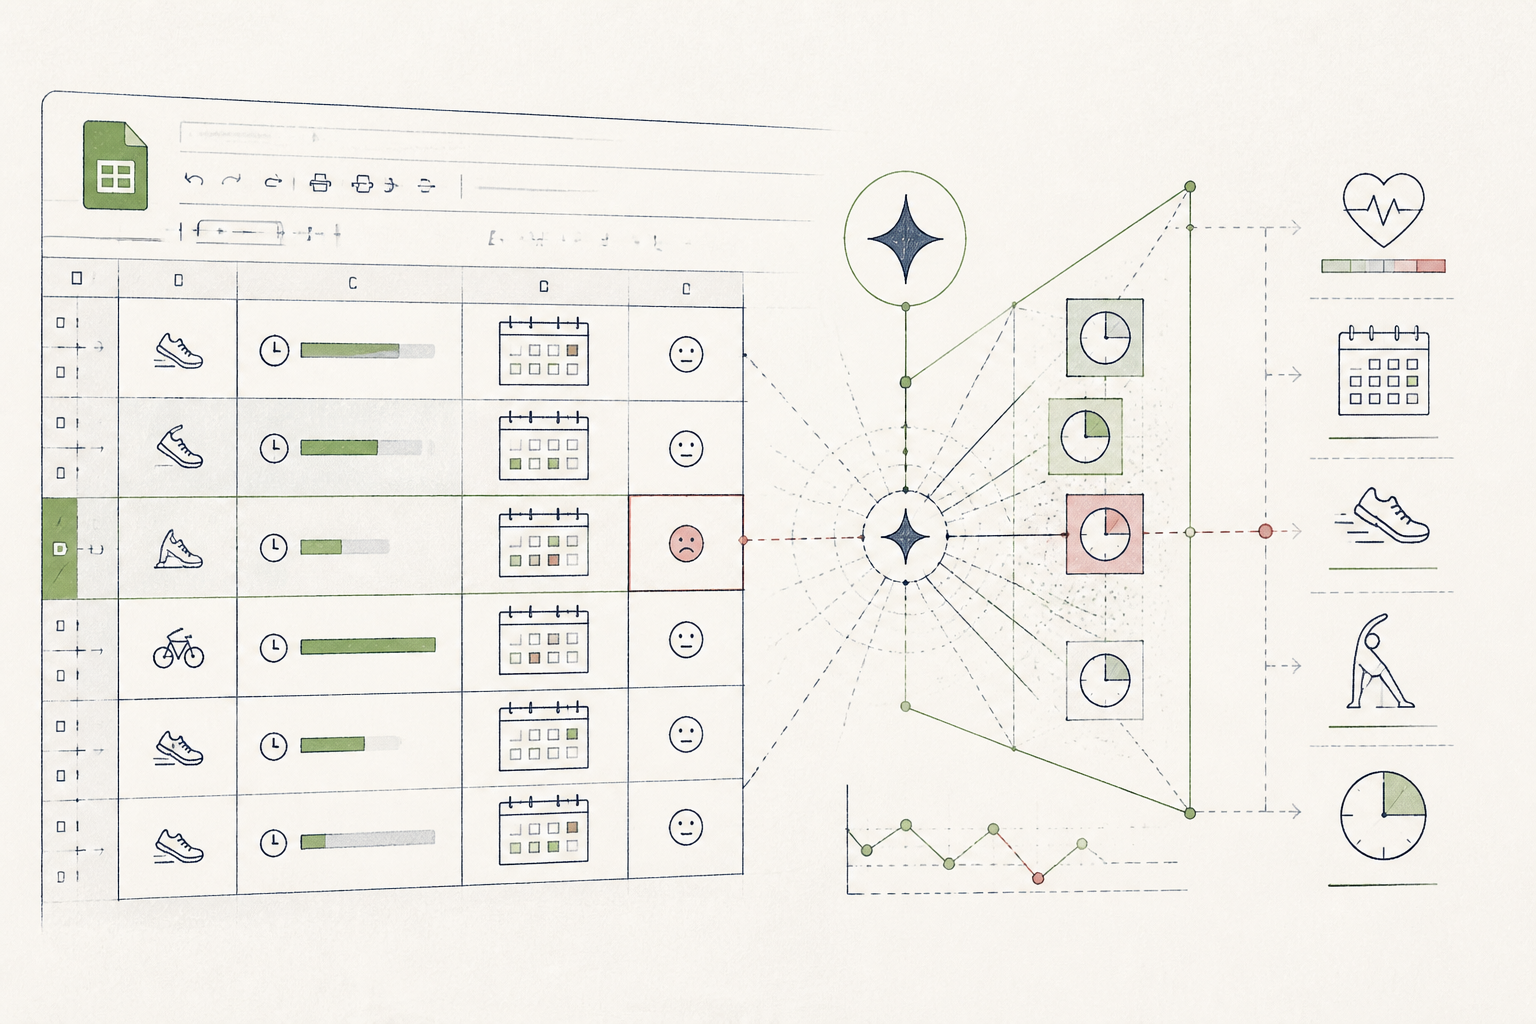
What the AI found
“AI found that clients who reported feeling "stiff" on Monday mornings consistently had less than 15 minutes of zone 2 cardiovascular activity the preceding Saturday, regardless of total weekly training volume.”
Before
Hours collating client training logs manually
After
6-minute AI-assisted movement review
The same system, three states — real screens, not a screenshot
| Client A (Movement Log) | Incomplete |
| Client B (Training Peaks) | Raw export |
| Client C (Strava) | PDF summary |
| Client D (Handwritten notes) | Pending transcription |
Prompt
Analyze the attached client movement data for the past 8 weeks. Look for correlations between reported Monday morning 'stiffness' and specific training variables, particularly Saturday activity type and duration. Quantify any patterns found.
Analyze the attached client movement data for the past 8 weeks. Look for correlations between reported Monday morning 'stiffness' and specific training variables, particularly Saturday activity type and duration. Quantify any patterns found.
AI
Across your client base, the three highest instances of reported 'stiffness' on Monday mornings consistently followed Saturdays where zone 2 cardiovascular activity was less than 15 minutes. This trend occurred even when total Saturday training duration was high, suggesting a threshold effect for low-intensity movement on recovery.78% of occurrences
Stiffness correlating with <15min Sat Zone 2
6 minutes
Average weekly review time
Reduced by 40%
Client feedback session prep time
Weekly Movement Review, Accelerated
A small clinic replaces manual data collation with an AI-assisted weekly movement summary, saving hours and revealing unseen patterns.
A nutritionist running a small EU practice, focused on athletic recovery.
Tools used
The real tools used here — swap any for your own equivalent. Each links to how we’d set it up.
Starting state
Before anything was set up
Before implementing the AI-assisted review, the nutritionist spent significant time each Sunday sifting through client-logged training data from various apps. This process was manual, prone to oversight, and made identifying subtle but important patterns across weeks nearly impossible. Information was scattered, and synthesizing it for client feedback was a laborious task, often delaying valuable insights.
| Client A (Movement Log) | Incomplete |
| Client B (Training Peaks) | Raw export |
| Client C (Strava) | PDF summary |
| Client D (Handwritten notes) | Pending transcription |
Working state
Hacks Pass, doing its job
The nutritionist consolidated client training data into a Google Sheet. They then used Gemini to analyze this aggregated data. The prompt directed the AI to look for correlations between subjective client reports (e.g., "stiffness") and objective training metrics, specifically focusing on recovery indicators and movement patterns over the preceding week. The AI's analysis quickly highlighted an unexpected link, providing concrete, actionable data points.
Prompt
Analyze the attached client movement data for the past 8 weeks. Look for correlations between reported Monday morning 'stiffness' and specific training variables, particularly Saturday activity type and duration. Quantify any patterns found.
Analyze the attached client movement data for the past 8 weeks. Look for correlations between reported Monday morning 'stiffness' and specific training variables, particularly Saturday activity type and duration. Quantify any patterns found.
AI
Across your client base, the three highest instances of reported 'stiffness' on Monday mornings consistently followed Saturdays where zone 2 cardiovascular activity was less than 15 minutes. This trend occurred even when total Saturday training duration was high, suggesting a threshold effect for low-intensity movement on recovery.Use case implemented
The finished system, running on its own
Now, every Sunday, the nutritionist exports the latest client data into the pre-formatted Google Sheet. Gemini then processes this data with a refined prompt, generating a concise summary of movement patterns and identifying potential areas for adjustment. This automated process ensures a consistent, data-driven review that is both efficient and insightful, allowing for more proactive client support and focused feedback sessions.
78% of occurrences
Stiffness correlating with <15min Sat Zone 2
6 minutes
Average weekly review time
Reduced by 40%
Client feedback session prep time
What an outside observer would notice
2 hours
Time saved per weekly client review
Up 25%
Identified client movement patterns
Up 15%
Proactive client adjustments
The stack — build it yourself
Universal compatibility for client data exports, easy to structure for AI input.
Its advanced reasoning handles complex data correlations and provides nuanced, quantified insights from unstructured text.
These are the tools used in this story. Any can be swapped for an equivalent you already trust.
Go deeper
Do this yourself
See Hacks Pass
This story runs on Hacks Pass. The tools and prompts above are the real build — swap any tool for your own equivalent and follow the same steps.