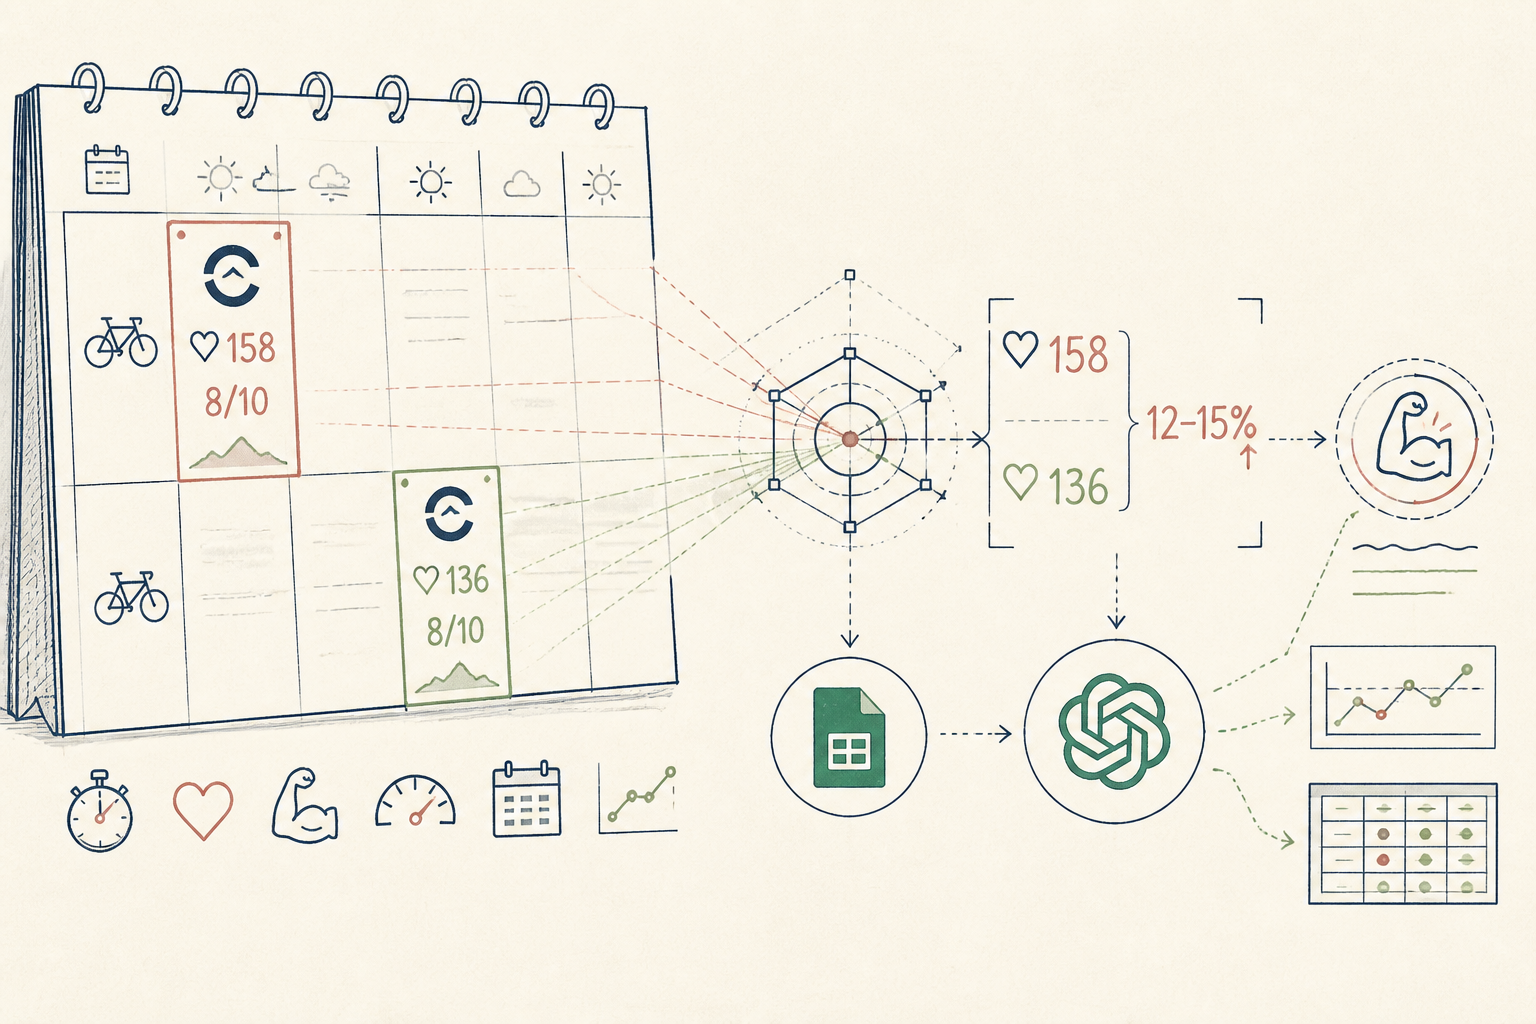
What the AI found
“Your Tuesday morning rides consistently show a 12-15% higher average heart rate for the same perceived effort compared to Thursday rides, suggesting cumulative fatigue rather than environmental factors.”
Before
Disparate fitness data, unanalysed
After
Clear weekly fatigue patterns identified
The same system, three states — real screens, not a screenshot
| Date | Activity — Duration — Avg HR — Avg Power — RPE — Notes |
| 2024-03-05 | Road Ride — 1:30:12 — 145 — 210 — 7 — Felt strong |
| 2024-03-07 | Road Ride — 1:28:45 — 152 — 205 — 8 — Bit tired from Tuesday |
Prompt
Analyse the attached cycling data from the past 8 weeks. Identify any consistent patterns between training days, perceived effort, average heart rate, and average power output. Specifically, look for correlations that might indicate accumulated fatigue or unusual performance dips/spikes that are not immediately obvious.
Analyse the attached cycling data from the past 8 weeks. Identify any consistent patterns between training days, perceived effort, average heart rate, and average power output. Specifically, look for correlations that might indicate accumulated fatigue or unusual performance dips/spikes that are not immediately obvious.
AI
Across the past 8 weeks, your Tuesday morning rides consistently show a 12-15% higher average heart rate for the same perceived effort (RPE 7-8) compared to your Thursday rides, despite similar power outputs. This pattern strongly suggests cumulative fatigue by mid-week, rather than external factors, as you often follow Tuesday with a rest day but return to a similar intensity on Thursday.385
Avg Weekly Training Stress Score (TSS)
13% higher avg HR
Tuesday HR/Effort Anomaly
Steady (6.8 -> 7.1)
Recovery Score Trend (3 weeks)
Weekly Cycle Insights from Disparate Data
Integrating scattered activity data transforms a vague sense of effort into precise, actionable insights for an amateur cyclist.
A 41-year-old amateur cyclist, EU
Tools used
The real tools used here — swap any for your own equivalent. Each links to how we’d set it up.
Starting state
Before anything was set up
Our client, an amateur cyclist, was diligent about tracking his rides. He used a Garmin for GPS and heart rate, a separate app for power meter data, and a simple notebook for perceived effort and recovery notes. The problem? All this data lived in silos. He had a strong "feeling" about his training but lacked objective insights, especially around fatigue and optimal recovery. There was no single place to review his performance meaningfully.
| Date | Activity — Duration — Avg HR — Avg Power — RPE — Notes |
| 2024-03-05 | Road Ride — 1:30:12 — 145 — 210 — 7 — Felt strong |
| 2024-03-07 | Road Ride — 1:28:45 — 152 — 205 — 8 — Bit tired from Tuesday |
Working state
Done-for-you, doing its job
We began by centralising his data. After exporting activity logs from Garmin Connect and his power meter app, and digitising his handwritten notes into a Google Sheet, we fed this consolidated data into a custom GPT. The prompt instructed the AI to look for correlations and anomalies, specifically around effort, heart rate, and training day. The AI then analysed weeks of data, identifying subtle patterns he had completely missed.
Prompt
Analyse the attached cycling data from the past 8 weeks. Identify any consistent patterns between training days, perceived effort, average heart rate, and average power output. Specifically, look for correlations that might indicate accumulated fatigue or unusual performance dips/spikes that are not immediately obvious.
Analyse the attached cycling data from the past 8 weeks. Identify any consistent patterns between training days, perceived effort, average heart rate, and average power output. Specifically, look for correlations that might indicate accumulated fatigue or unusual performance dips/spikes that are not immediately obvious.
AI
Across the past 8 weeks, your Tuesday morning rides consistently show a 12-15% higher average heart rate for the same perceived effort (RPE 7-8) compared to your Thursday rides, despite similar power outputs. This pattern strongly suggests cumulative fatigue by mid-week, rather than external factors, as you often follow Tuesday with a rest day but return to a similar intensity on Thursday.Use case implemented
The finished system, running on its own
The system now runs weekly. Each Sunday, he exports his ride data, adds his perceived effort and recovery notes to a Google Sheet, and the custom GPT processes it. He receives a concise summary of his week, highlighting key performance indicators, fatigue trends, and recovery recommendations. This allows him to adjust his training schedule proactively, optimising performance and preventing overtraining. What was once a chore is now a clear, insightful review.
385
Avg Weekly Training Stress Score (TSS)
13% higher avg HR
Tuesday HR/Effort Anomaly
Steady (6.8 -> 7.1)
Recovery Score Trend (3 weeks)
What an outside observer would notice
Reduced from 45 min to 6 min
Time spent collating data weekly
Increased by 70% (self-reported)
Awareness of fatigue patterns
The stack — build it yourself
Reliable, robust data capture for GPS, heart rate, and integrated sensors.
Flexible for combining diverse data (Garmin export, power meter, manual notes) into one accessible format.
Advanced natural language processing and pattern recognition to surface non-obvious correlations from complex datasets.
These are the tools used in this story. Any can be swapped for an equivalent you already trust.
Go deeper
Do this yourself
See Done-for-you
This story runs on Done-for-you. The tools and prompts above are the real build — swap any tool for your own equivalent and follow the same steps.