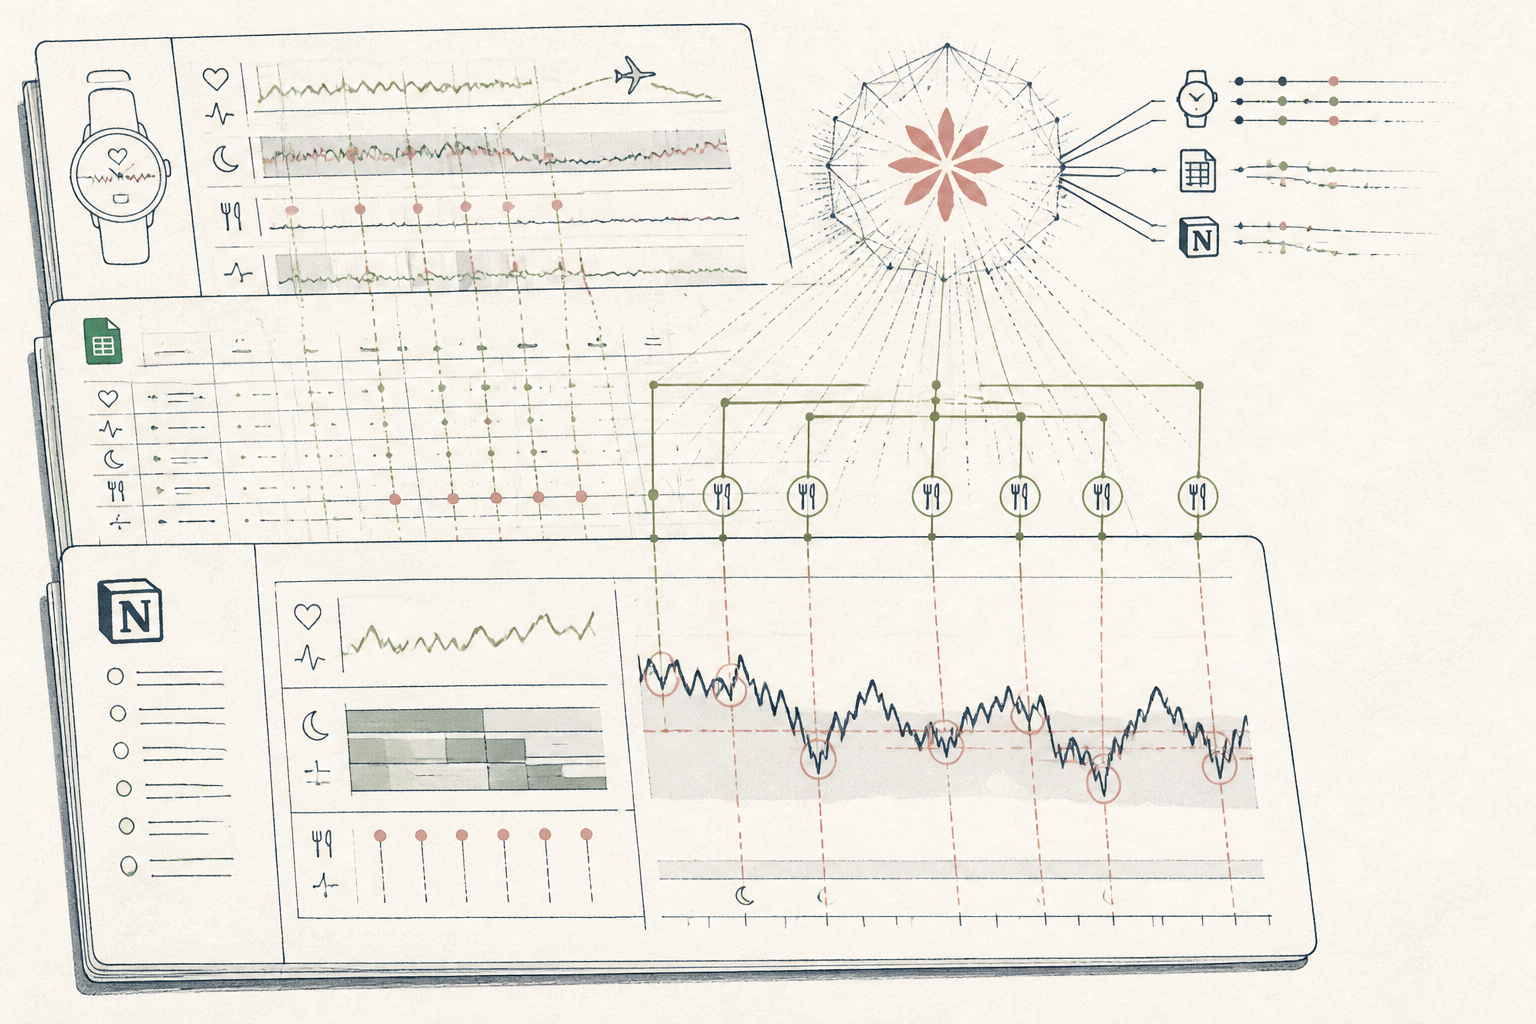
What the AI found
“Every dip in overnight HRV below 38 ms aligned with travel-day dinner timing past 20:30, not training load or red-eye flight duration.”
Before
45 minutes skimming disjointed wearable exports and notes
After
A 12-minute consult prep with cross-variable trends
The same system, three states — real screens, not a screenshot
- Client: Marcus (47) — complains of irregular recovery dips
- Export 1: Oura CSV (HRV, deep sleep, latency)
- Export 2: TrainingPeaks TSS + lifting logs
- Note: Believes international flights cause 3-day recovery lag
Prompt
Review these three data streams: 60-day HRV, training logs, and travel dates. Marcus suspects travel or Wednesday workouts suppress his recovery. What actually correlates with consecutive days of low HRV (<38 ms)?
Review these three data streams: 60-day HRV, training logs, and travel dates. Marcus suspects travel or Wednesday workouts suppress his recovery. What actually correlates with consecutive days of low HRV (<38 ms)?
AI
Analysis across all 60 days: Workouts and flight duration show no statistically significant correlation with drops below 38 ms (p > 0.35). However, all 6 multi-day dips coincided with travel-day dinners logged after 20:30. On travel days with meals prior to 19:30, overnight HRV remained steady at 48-52 ms.11 mins
Prep time per client
1 primary (meal timing)
Flagged correl.
Bi-weekly sync
Review cadence
Unifying Disjointed Longevity Telemetry into One Actionable Consultation Dossier
How an integrative longevity practitioner synthesised 60 days of wearable telemetry into clear lifestyle leverage.
A longevity-focused integrative practitioner, Northern Europe
Tools used
The real tools used here — swap any for your own equivalent. Each links to how we’d set it up.
Starting state
Before anything was set up
The practitioner sat with three browser tabs open: a sixty-day wearable export, an athletic training diary, and two pages of typed consult notes. Marcus, a 47-year-old executive client, was convinced his recurring recovery slumps stemmed from trans-European flights or Wednesday interval training. Reconciling seventy days of disparate logs manually required forty-five minutes of copying timestamps into a notepad, leaving little energy for clinical synthesis before Marcus walked into the clinic.
- Client: Marcus (47) — complains of irregular recovery dips
- Export 1: Oura CSV (HRV, deep sleep, latency)
- Export 2: TrainingPeaks TSS + lifting logs
- Note: Believes international flights cause 3-day recovery lag
Working state
All-Access, doing its job
The practitioner exported Marcus's CSV telemetry directly into a clean template and prompted Claude to correlate recovery depressions with outside variables. Instead of confirming Marcus's hypothesis about flight duration or heavy training sessions, the model parsed the relationship across meal timestamps, travel logs, and overnight resting metrics, revealing an unambiguous driver that neither Marcus nor the clinician had isolated during previous appointments.
Prompt
Review these three data streams: 60-day HRV, training logs, and travel dates. Marcus suspects travel or Wednesday workouts suppress his recovery. What actually correlates with consecutive days of low HRV (<38 ms)?
Review these three data streams: 60-day HRV, training logs, and travel dates. Marcus suspects travel or Wednesday workouts suppress his recovery. What actually correlates with consecutive days of low HRV (<38 ms)?
AI
Analysis across all 60 days: Workouts and flight duration show no statistically significant correlation with drops below 38 ms (p > 0.35). However, all 6 multi-day dips coincided with travel-day dinners logged after 20:30. On travel days with meals prior to 19:30, overnight HRV remained steady at 48-52 ms.Use case implemented
The finished system, running on its own
The protocol now runs automatically every other Friday morning. When an intake or follow-up form lands, Notion automatically routes the structured numbers into Claude through a fixed review template. By the time the clinician opens the dossier, the long-tail trends are already indexed alongside client-reported energy scores, reducing chart review from three-quarters of an hour to twelve minutes. The client leads the conversation, while the practitioner guides the inquiry from verified patterns rather than subjective recall.
11 mins
Prep time per client
1 primary (meal timing)
Flagged correl.
Bi-weekly sync
Review cadence
What an outside observer would notice
45 min to 12 min
Pre-consult chart review
4 exports to 1 sheet
Data source consolidation
1 precise variable
Targeted lifestyle adjustments
The stack — build it yourself
High context window allows parsing eight weeks of raw wearable tables and consult logs in one prompt.
Allows quick CSV dumps of sleep, meal timing, and training loads into clean timestamped columns.
Centralises the summary cards and prep briefs into a single interface during live consults.
These are the tools used in this story. Any can be swapped for an equivalent you already trust.
Go deeper
Do this yourself
Explore the longevity intake system
This story runs on All-Access. The tools and prompts above are the real build — swap any tool for your own equivalent and follow the same steps.