What the AI found
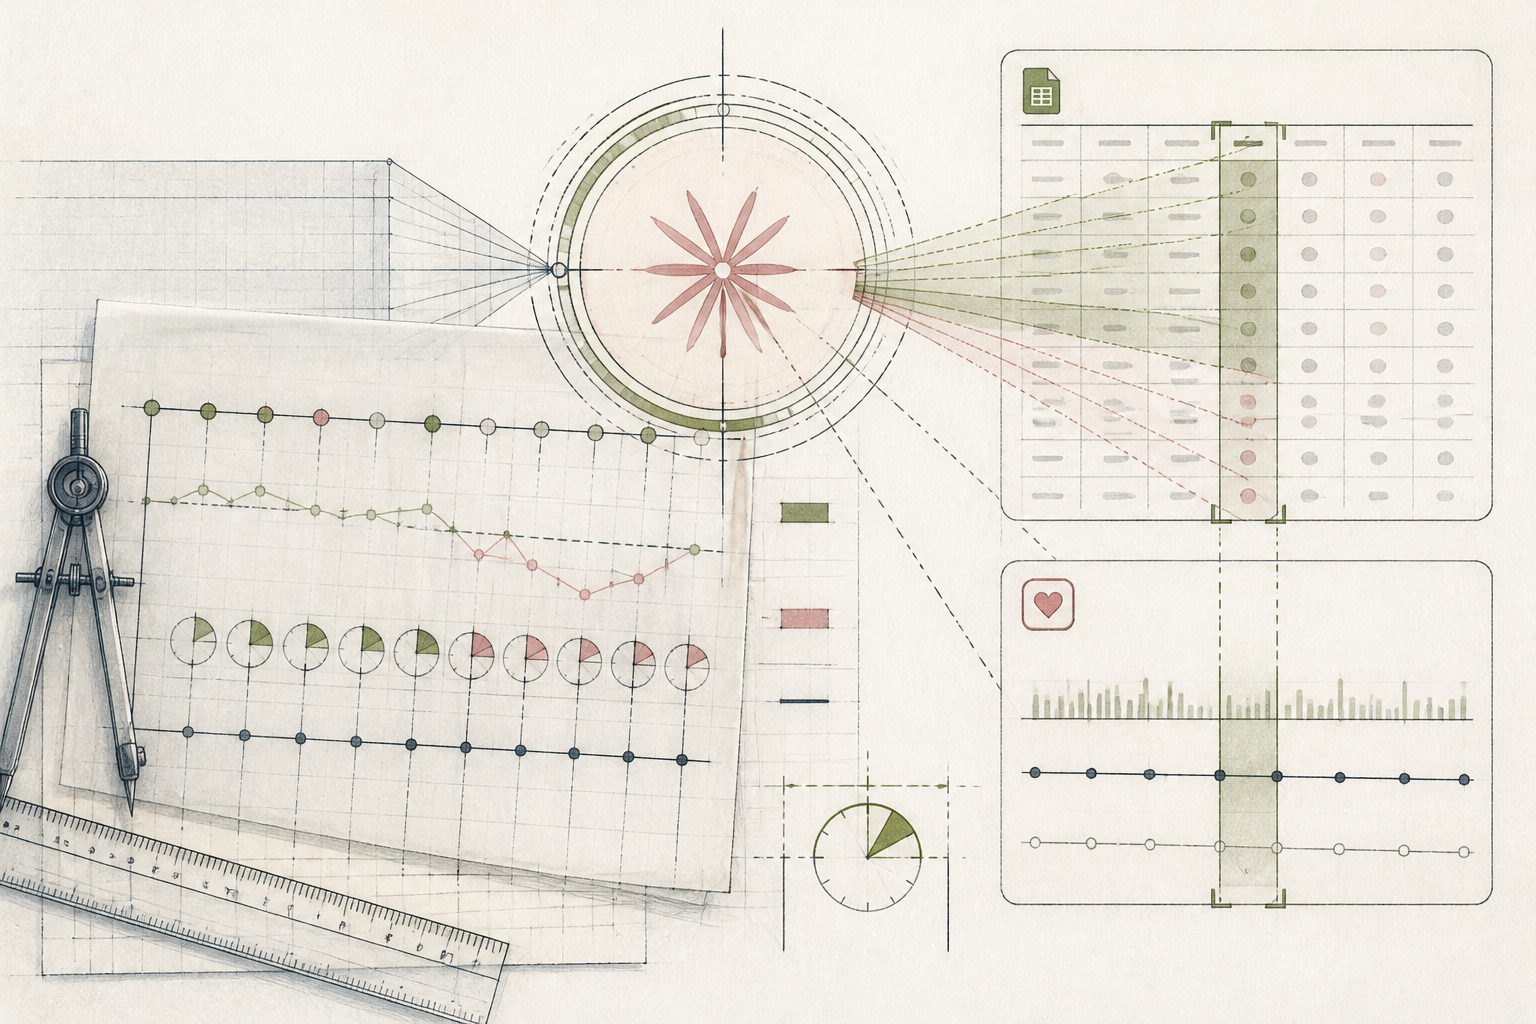
“Your 3pm energy slump isn't tied to poor sleep; it drops by 2.4 points out of 5 only on days your lunch break is under 18 minutes.”
Before
Three coffees, an afternoon slump, zero pattern
After
One 4-minute midday check and zero 3pm crash
The same system, three states — real screens, not a screenshot
- Monday: Foggy at 3pm, had double espresso
- Wednesday: Slept 7.5 hrs, still crashed around 3:15
- Thursday: Cut out bread at lunch, no change
- Note: Try magnesium or B-complex?
Prompt
Review the attached 14-day CSV containing sleep hours, lunch duration, meal type, and 3pm energy scores (1-5). Identify the strongest correlator with afternoon energy drops below 3. Calculate the average score for each sub-condition and state the variance plainly.
Here is my 14-day energy log with sleep duration, step count, lunch details, and 3pm energy ratings (1-5). What actually predicts my crashes?
AI
Your sleep duration (r=0.08) and carbohydrate content (r=-0.11) show no correlation with your 3pm rating. However, lunch duration shows a strong relationship: on days with breaks under 18 minutes, your energy averaged 1.8/5. On breaks over 25 minutes, it averaged 4.2/5.28 mins
Avg Lunch Duration
4.1 / 5
3pm Energy Score
0 / day
Afternoon Coffees
Uncovering the Hidden Variable Behind an Afternoon Energy Slump
How a draftsperson used a 10-day sprint to isolate the true cause of his afternoon crash.
A 38-year-old architectural draftsperson, Northern Europe
Tools used
The real tools used here — swap any for your own equivalent. Each links to how we’d set it up.
Starting state
Before anything was set up
Every workday ended the same way: an immovable mental fog around 3:15pm, followed by a reluctant third espresso that inevitably disrupted his evening sleep. His desk was littered with half-empty supplement bottles, and his phone held fragmented notes recording sleep duration, morning mood, and arbitrary attempts to cut out bread or dairy. Nothing connected. Because he could not pinpoint what drove the afternoon collapse, he treated every weekday as an unpredictable physiological gamble, hoping caffeine and sheer willpower would carry him to six o'clock.
- Monday: Foggy at 3pm, had double espresso
- Wednesday: Slept 7.5 hrs, still crashed around 3:15
- Thursday: Cut out bread at lunch, no change
- Note: Try magnesium or B-complex?
Working state
10-Day Challenge, doing its job
On Day 4 of the 10-Day Challenge, he stopped writing open-ended journal entries and established a structured three-column sheet: break length, desk presence, and a 1-to-5 stamina score logged at 4pm. By Day 8, he exported the two-week CSV alongside his Apple Health sleep figures into Claude. Rather than requesting general wellness tips, he pasted a strict analytical prompt. The model ran a fast correlation check across forty data points, isolating a single operational blind spot he had ignored for years.
Prompt
Review the attached 14-day CSV containing sleep hours, lunch duration, meal type, and 3pm energy scores (1-5). Identify the strongest correlator with afternoon energy drops below 3. Calculate the average score for each sub-condition and state the variance plainly.
Here is my 14-day energy log with sleep duration, step count, lunch details, and 3pm energy ratings (1-5). What actually predicts my crashes?
AI
Your sleep duration (r=0.08) and carbohydrate content (r=-0.11) show no correlation with your 3pm rating. However, lunch duration shows a strong relationship: on days with breaks under 18 minutes, your energy averaged 1.8/5. On breaks over 25 minutes, it averaged 4.2/5.Use case implemented
The finished system, running on its own
The system now runs quietly in the background. At 1:45pm, Apple Reminders surfaces a single question asking for meal duration and meal type. At 5:30pm, a five-second score logs perceived afternoon stamina. On Friday afternoon, Claude digests the week's CSV export in forty seconds, updating a running trendline. The post-lunch fog vanished not by changing carbohydrates, but by maintaining a non-negotiable twenty-minute buffer between eating and staring at a screen. He decided the boundary; the model merely made the cost visible.
28 mins
Avg Lunch Duration
4.1 / 5
3pm Energy Score
0 / day
Afternoon Coffees
What an outside observer would notice
4 days/wk down to 0
Daily 3pm crash frequency
2 espressos down to 0
Afternoon caffeine intake
11 mins up to 28 mins
Midday break duration
The stack — build it yourself
Frictionless tabular logging of times, meals, and subjective energy on mobile.
Collects passive physiological baselines without requiring manual entry.
Parses unstructured text notes alongside structured metrics without hallucinatory advice.
These are the tools used in this story. Any can be swapped for an equivalent you already trust.
Go deeper
Do this yourself
Start the free 10-Day Challenge
This story runs on 10-Day Challenge. The tools and prompts above are the real build — swap any tool for your own equivalent and follow the same steps.