What the AI found
“Your Tuesday recovery run averaged 151 bpm on hills, meaning 41% of your supposed zone 2 volume was spent in zone 3, driving your Thursday fatigue.”
Before
9 hours logged, resting heart rate drifting upward
After
One 4-minute weekly audit of true zone 2 volume
The same system, three states — real screens, not a screenshot
- Tue: 11km road run (felt sluggish, legs heavy)
- Thu: 60m indoor spin (RHR elevated +4bpm at wake)
- Sat: 18km long run (avg 146 bpm, planned <138 bpm)
- Note: Why is recovery score dropping despite 8h sleep?
Prompt
Here is a CSV export of my last 12 aerobic runs with 10-second heart rate samples and elevation. My ceiling for Zone 2 is 138 bpm. Identify every instance where I exceeded this ceiling for more than 90 consecutive seconds, calculate the percentage of total time spent above it, and flag any geographic or pacing commonalities.
Here is a CSV export of my last 12 aerobic runs with 10-second heart rate samples and elevation. My ceiling for Zone 2 is 138 bpm. Identify every instance where I exceeded this ceiling for more than 90 consecutive seconds, calculate the percentage of total time spent above it, and flag any geographic or pacing commonalities.
AI
Across 12 sessions, you logged 9h 14m. However, 3h 48m (41.2% of total time) was spent above 138 bpm. This was not random cardiovascular drift: in 11 out of 12 runs, heart rate exceeded 148 bpm within 180 seconds of hitting any grade steeper than 3.5%, primarily on the Tuesday river loop. Your body was performing mid-tempo intervals during designated active recovery.3h 40m / wk
True Zone 2 Volume
51 bpm
Avg RHR (7-day)
< 4%
Threshold Leakage
Uncovering hidden intensity creep in a longevity running routine
How a runner used a targeted prompt pass to audit hidden threshold leakage in her aerobic longevity routine.
A 44-year-old architectural consultant and masters runner, Northern Europe
Tools used
The real tools used here — swap any for your own equivalent. Each links to how we’d set it up.
Starting state
Before anything was set up
Nine hours of endurance work were logged faithfully each week into Apple Health, intended strictly for mitochondrial efficiency and lifelong cardiovascular fitness. Yet waking heart rate was creeping upward, from 52 to 56 bpm over two months. Workouts felt heavier instead of lighter. She suspected insufficient sleep or dietary protein, but her spreadsheet notes offered only vague impressions and conflicting subjective ratings. The raw workout files sat unexamined in her phone.
- Tue: 11km road run (felt sluggish, legs heavy)
- Thu: 60m indoor spin (RHR elevated +4bpm at wake)
- Sat: 18km long run (avg 146 bpm, planned <138 bpm)
- Note: Why is recovery score dropping despite 8h sleep?
Working state
Hacks Pass, doing its job
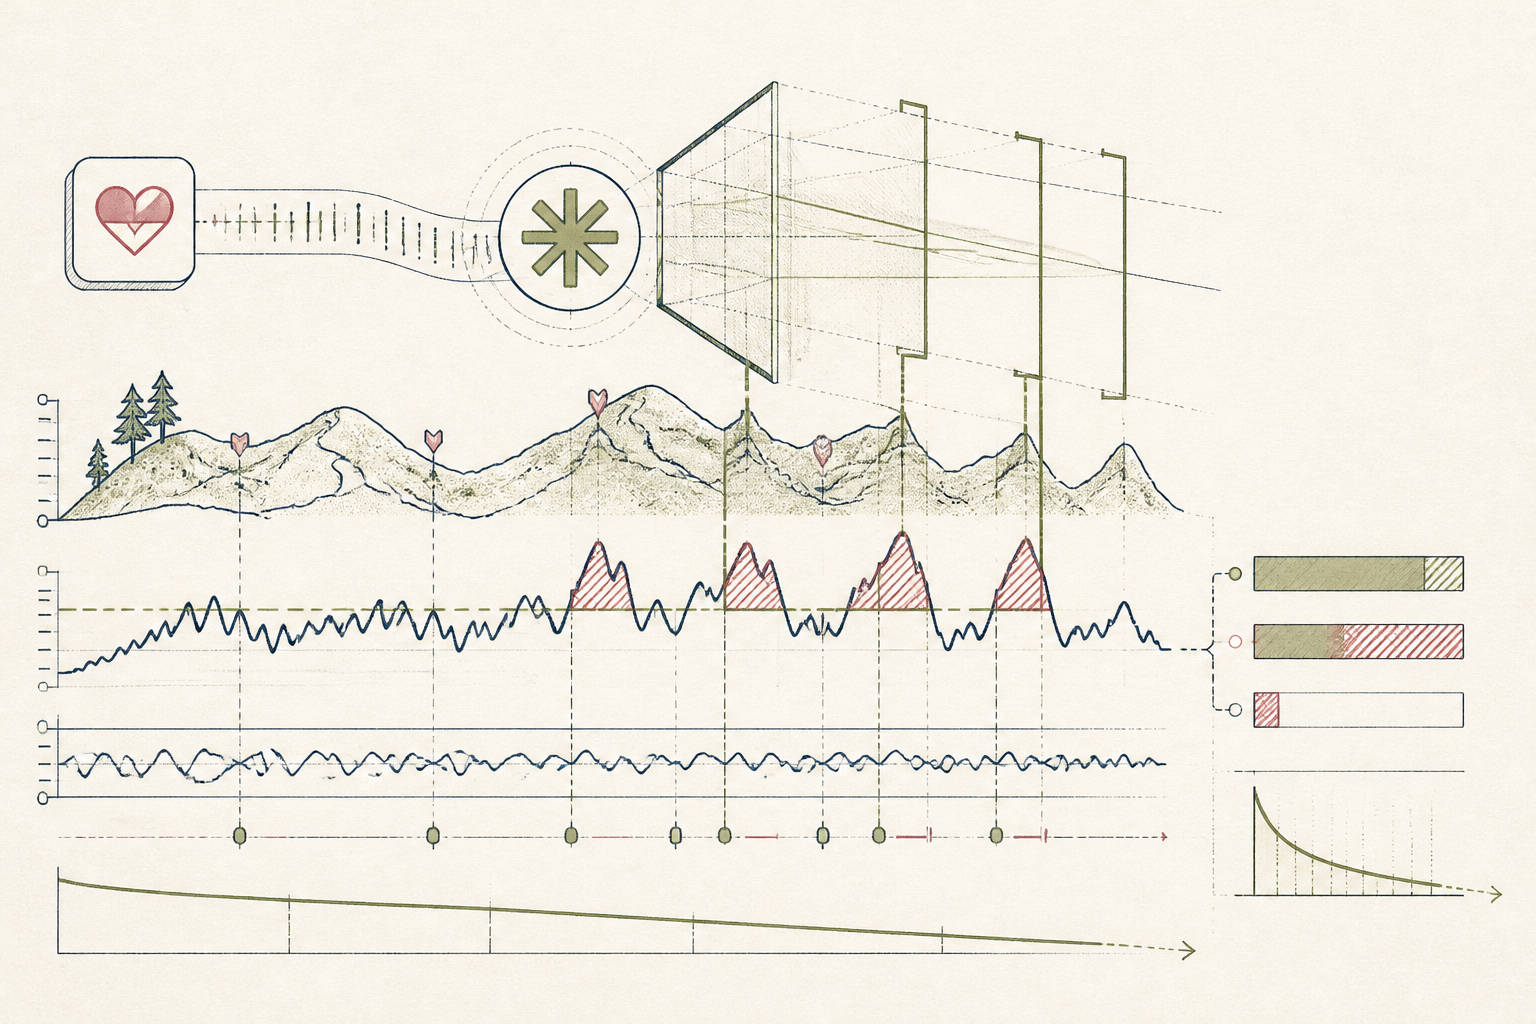
Using the structured prompt provided in the daily pass, she exported her raw interval logs from Apple Health as a structured text table. She dropped the data into Claude on a Sunday afternoon. Instead of offering generic advice on sleep hygiene or supplements, the model correlated heart rate directly against the route profile, pinpointing an unperceived 41% leakage into zone 3 and 4 caused by keeping pace constant on slight hills.
Prompt
Here is a CSV export of my last 12 aerobic runs with 10-second heart rate samples and elevation. My ceiling for Zone 2 is 138 bpm. Identify every instance where I exceeded this ceiling for more than 90 consecutive seconds, calculate the percentage of total time spent above it, and flag any geographic or pacing commonalities.
Here is a CSV export of my last 12 aerobic runs with 10-second heart rate samples and elevation. My ceiling for Zone 2 is 138 bpm. Identify every instance where I exceeded this ceiling for more than 90 consecutive seconds, calculate the percentage of total time spent above it, and flag any geographic or pacing commonalities.
AI
Across 12 sessions, you logged 9h 14m. However, 3h 48m (41.2% of total time) was spent above 138 bpm. This was not random cardiovascular drift: in 11 out of 12 runs, heart rate exceeded 148 bpm within 180 seconds of hitting any grade steeper than 3.5%, primarily on the Tuesday river loop. Your body was performing mid-tempo intervals during designated active recovery.Use case implemented
The finished system, running on its own
The routine now runs on automatic pilot every Sunday evening. A simple export from Apple Health passes into Claude via an automated shortcut. Within seconds, a four-line summary isolates any heart-rate creep across her endurance sessions. She no longer second-guesses her recovery days or adds junk volume. Her baseline resting heart rate settled back down to 51 bpm over six weeks, simply because her easy training sessions finally stayed strictly easy.
3h 40m / wk
True Zone 2 Volume
51 bpm
Avg RHR (7-day)
< 4%
Threshold Leakage
What an outside observer would notice
-88%
Unintended Zone 3 time
4 mins
Weekly review time
-4 bpm
Resting heart rate delta
The stack — build it yourself
Consolidates continuous optical heart rate and GPS elevation from daily road sessions without manual logging.
Handles large tabular text dumps reliably without hallucinating timestamps or miscalculating zone percentages.
These are the tools used in this story. Any can be swapped for an equivalent you already trust.
Go deeper
Do this yourself
Read the daily protocol pass
This story runs on Hacks Pass. The tools and prompts above are the real build — swap any tool for your own equivalent and follow the same steps.