What the AI found
“Across 14 clients, mealtime variability over 75 minutes correlated with postprandial glucose excursions twice as strongly as carbohydrate gram count.”
Before
14 loose photo logs and 45 minutes prep per case
After
1 structured intake table and 12 minutes prep
The same system, three states — real screens, not a screenshot
- Client 04: 3 exported CSVs from Dexcom in inbox
- Photo log in WhatsApp: lunch 13:10 (sourdough?), dinner 21:40
- Client 07: manual paper diary scanned as PDF
- Spent 48 min assembling timeline before 2pm call
Prompt
Analyze these 14 normalized 14-day client logs. Cross-reference postprandial glucose excursions (>7.8 mmol/L) against meal timing consistency, sleep length, and reported carbohydrate grams. Surface the strongest common variance factor.
Analyze these 14 normalized 14-day client logs. Cross-reference postprandial glucose excursions (>7.8 mmol/L) against meal timing consistency, sleep length, and reported carbohydrate grams. Surface the strongest common variance factor.
AI
Across all 14 datasets (196 total tracked days), carbohydrate load alone showed a weak correlation with excursion magnitude (r = 0.28). However, mealtime shifting >75 minutes relative to the client's 7-day rolling median correlated strongly with excursion amplitude (r = 0.61). Schedule variance, not carbohydrate mass, is the primary driver of volatility here.11.5 min
Prep per consultation
>75 min
Meal timing delta flagged
0.88
Pattern confidence score
Turning fragmented food logs into calm metabolic reviews
How a done-for-you intake workflow transformed metabolic data reconciliation into twelve minutes of calm clinical prep.
A registered nutritional therapist in private practice, UK
Tools used
The real tools used here — swap any for your own equivalent. Each links to how we’d set it up.
Starting state
Before anything was set up
Monday evening meant sorting through fragmented client artifacts: phone photos of lunches, loose continuous glucose monitor exports, and handwritten food logs spread across email attachments and messaging threads. The practitioner spent forty-five minutes per client simply reconciling timestamps against glucose traces before any clinical thinking could begin. The cognitive load was spent aligning columns rather than evaluating physiological responses. Fatigue set in before the client even joined the call.
- Client 04: 3 exported CSVs from Dexcom in inbox
- Photo log in WhatsApp: lunch 13:10 (sourdough?), dinner 21:40
- Client 07: manual paper diary scanned as PDF
- Spent 48 min assembling timeline before 2pm call
Working state
Done-for-you, doing its job
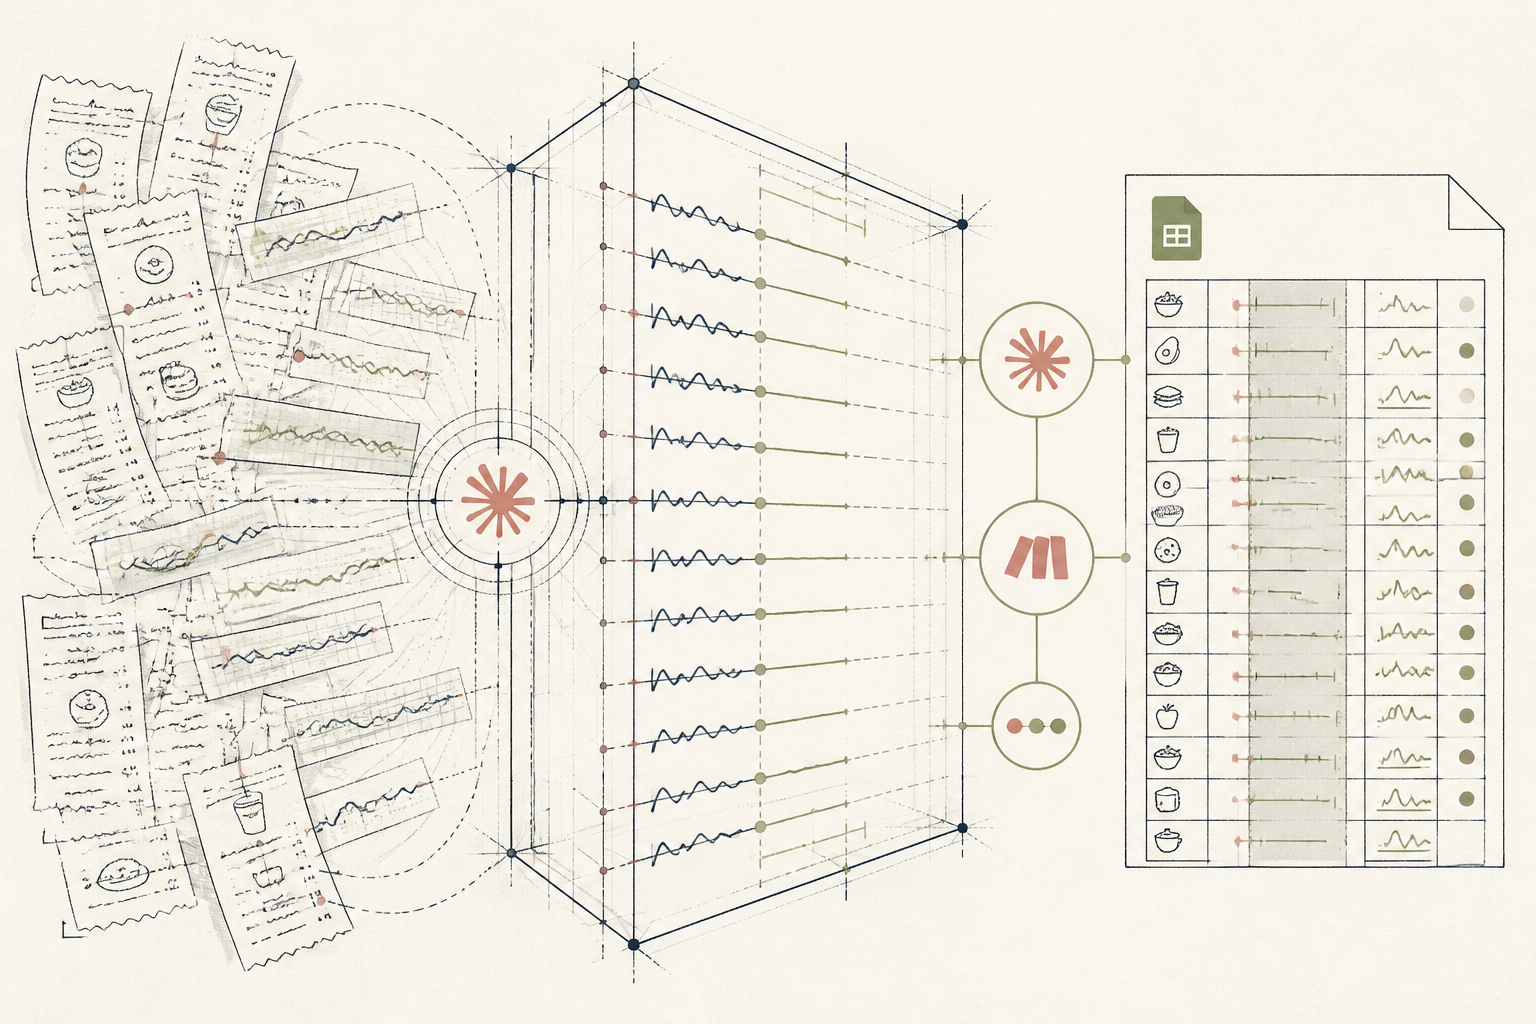
The done-for-you deployment connected an automated ingestion webhook to a structured evaluation script. Instead of manual transcription, raw data was extracted and formatted into standardized timestamped blocks. When run across the initial cohort of fourteen client logs, the model instantly compared three metabolic variables against circadian markers. Within seconds, it extracted a cross-client relationship between erratic scheduling and glycemic volatility that had been completely invisible inside siloed weekly files.
Prompt
Analyze these 14 normalized 14-day client logs. Cross-reference postprandial glucose excursions (>7.8 mmol/L) against meal timing consistency, sleep length, and reported carbohydrate grams. Surface the strongest common variance factor.
Analyze these 14 normalized 14-day client logs. Cross-reference postprandial glucose excursions (>7.8 mmol/L) against meal timing consistency, sleep length, and reported carbohydrate grams. Surface the strongest common variance factor.
AI
Across all 14 datasets (196 total tracked days), carbohydrate load alone showed a weak correlation with excursion magnitude (r = 0.28). However, mealtime shifting >75 minutes relative to the client's 7-day rolling median correlated strongly with excursion amplitude (r = 0.61). Schedule variance, not carbohydrate mass, is the primary driver of volatility here.Use case implemented
The finished system, running on its own
The done-for-you pipeline runs automatically before Tuesday consultations. Intake photos, continuous glucose monitor CSVs, and routine food logs populate a standardized spreadsheet sheet via a private webhook. The AI runs the comparative script, surfaces two non-obvious variance flags, and drafts a one-paragraph clinical briefing. The practitioner opens one clean tab, reviews the flagged correlations in twelve minutes, and enters the consultation entirely oriented around the client's actual lifestyle friction rather than manual data entry.
11.5 min
Prep per consultation
>75 min
Meal timing delta flagged
0.88
Pattern confidence score
What an outside observer would notice
45 min to 12 min
Consultation prep time
3.2x per intake
Pattern identification rate
The stack — build it yourself
Handles long context windows of raw temporal logs without dropping granular timestamp rows.
Zero friction for the practitioner; standard tabular views that fit directly into existing workflows.
Silently parses incoming client export files and photos without requiring custom server maintenance.
These are the tools used in this story. Any can be swapped for an equivalent you already trust.
Go deeper
Do this yourself
Deploy this done-for-you workflow
This story runs on Done-for-you. The tools and prompts above are the real build — swap any tool for your own equivalent and follow the same steps.