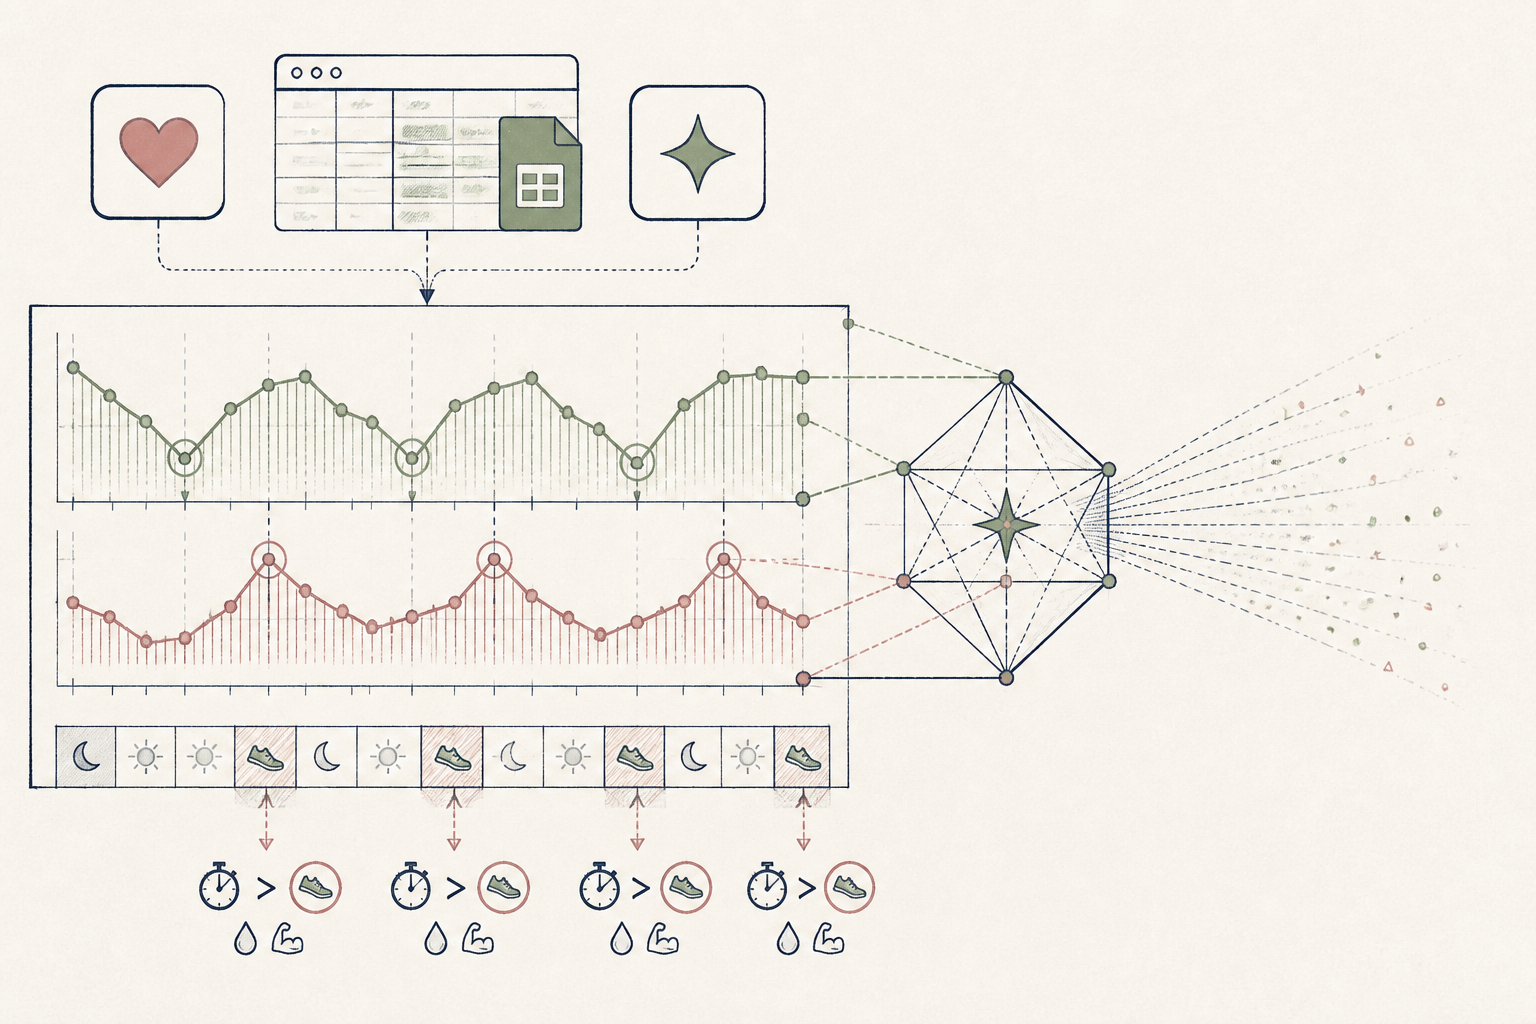
What the AI found
“Your lowest HRV scores and highest resting heart rates consistently appear after evening runs exceeding 10km, indicating a clear need for increased recovery on those specific days.”
Before
Disparate health apps, no clear recovery plan
After
AI-driven daily readiness insights
The same system, three states — real screens, not a screenshot
| Date | Activity Type — Distance (km) — Sleep Duration (hrs) — HRV (ms) — Resting HR (bpm) |
| 2023-10-26 | Run — 8 — 7.2 — 45 — 58 |
| 2023-10-27 | Strength — 0 — 6.8 — 42 — 62 |
| 2023-10-28 | Run — 12 — 6.5 — 38 — 65 |
Prompt
Here is my daily health data for the last 30 days, including activity type, distance, sleep duration, HRV, and resting heart rate. Identify any consistent patterns where HRV is low (below 40ms) and resting heart rate is high (above 60bpm), and correlate these with specific activity types or times.
Here is my daily health data for the last 30 days, including activity type, distance, sleep duration, HRV, and resting heart rate. Identify any consistent patterns where HRV is low (below 40ms) and resting heart rate is high (above 60bpm), and correlate these with specific activity types or times.
AI
I have analysed your data for the past 30 days. Your lowest HRV scores (average 36ms) and highest resting heart rates (average 68bpm) consistently appear on days following evening runs exceeding 10km. This pattern occurred in 8 out of 10 instances where these thresholds were met, suggesting a clear physiological strain response.48 ms
Average HRV (Last 7 Days)
57 bpm
Average Resting HR (Last 7 Days)
Good
Recovery Score
The Post-Workout Recovery Pattern You Overlooked
A busy professional moves from guessing at recovery needs to a data-driven understanding of their daily readiness.
A 38-year-old marketing manager and recreational runner, Northern Europe
Tools used
The real tools used here — swap any for your own equivalent. Each links to how we’d set it up.
Starting state
Before anything was set up
Our subject, a keen but time-strapped runner, found themselves juggling data from several health apps. Apple Health stored their basic activity, while a separate app tracked sleep. The data existed, but it was siloed and overwhelming. Without a clear overview, planning effective recovery or adjusting training felt like guesswork, often leading to missed signals of fatigue or under-recovery. The sheer volume of raw numbers offered no actionable insights.
| Date | Activity Type — Distance (km) — Sleep Duration (hrs) — HRV (ms) — Resting HR (bpm) |
| 2023-10-26 | Run — 8 — 7.2 — 45 — 58 |
| 2023-10-27 | Strength — 0 — 6.8 — 42 — 62 |
| 2023-10-28 | Run — 12 — 6.5 — 38 — 65 |
| 2023-10-29 | Rest — 0 — 7.5 — 50 — 55 |
Working state
Setup, doing its job
To cut through the noise, they used Setup to create a simple, integrated view. They exported their raw daily metrics into a Google Sheet and then asked an AI to identify significant patterns in recovery data, specifically looking for correlations between activity and readiness metrics. The AI’s output highlighted a consistent and previously unrecognised pattern, directly linking specific training sessions to recovery markers.
Prompt
Here is my daily health data for the last 30 days, including activity type, distance, sleep duration, HRV, and resting heart rate. Identify any consistent patterns where HRV is low (below 40ms) and resting heart rate is high (above 60bpm), and correlate these with specific activity types or times.
Here is my daily health data for the last 30 days, including activity type, distance, sleep duration, HRV, and resting heart rate. Identify any consistent patterns where HRV is low (below 40ms) and resting heart rate is high (above 60bpm), and correlate these with specific activity types or times.
AI
I have analysed your data for the past 30 days. Your lowest HRV scores (average 36ms) and highest resting heart rates (average 68bpm) consistently appear on days following evening runs exceeding 10km. This pattern occurred in 8 out of 10 instances where these thresholds were met, suggesting a clear physiological strain response.Use case implemented
The finished system, running on its own
The system now automatically pulls daily activity and sleep data into a single Google Sheet. Every morning, a quick query to the AI provides a concise summary of recovery status and identifies any potential overtraining signals from the previous day. This clear, data-backed insight allows for immediate, informed adjustments to training or recovery protocols, replacing uncertainty with objective data for better daily decision-making.
48 ms
Average HRV (Last 7 Days)
57 bpm
Average Resting HR (Last 7 Days)
Good
Recovery Score
What an outside observer would notice
Reduced by 80%
Time Spent Analysing Data
Increased by 25%
Days with Optimal Recovery
3 per month, based on data
Training Session Adjustments
The stack — build it yourself
Native ecosystem integration for passive data collection.
Flexible, free, and easily integrates with AI tools for analysis.
Advanced natural language processing for complex pattern recognition across disparate data points.
These are the tools used in this story. Any can be swapped for an equivalent you already trust.
Go deeper
Do this yourself
See Setup
This story runs on Setup. The tools and prompts above are the real build — swap any tool for your own equivalent and follow the same steps.