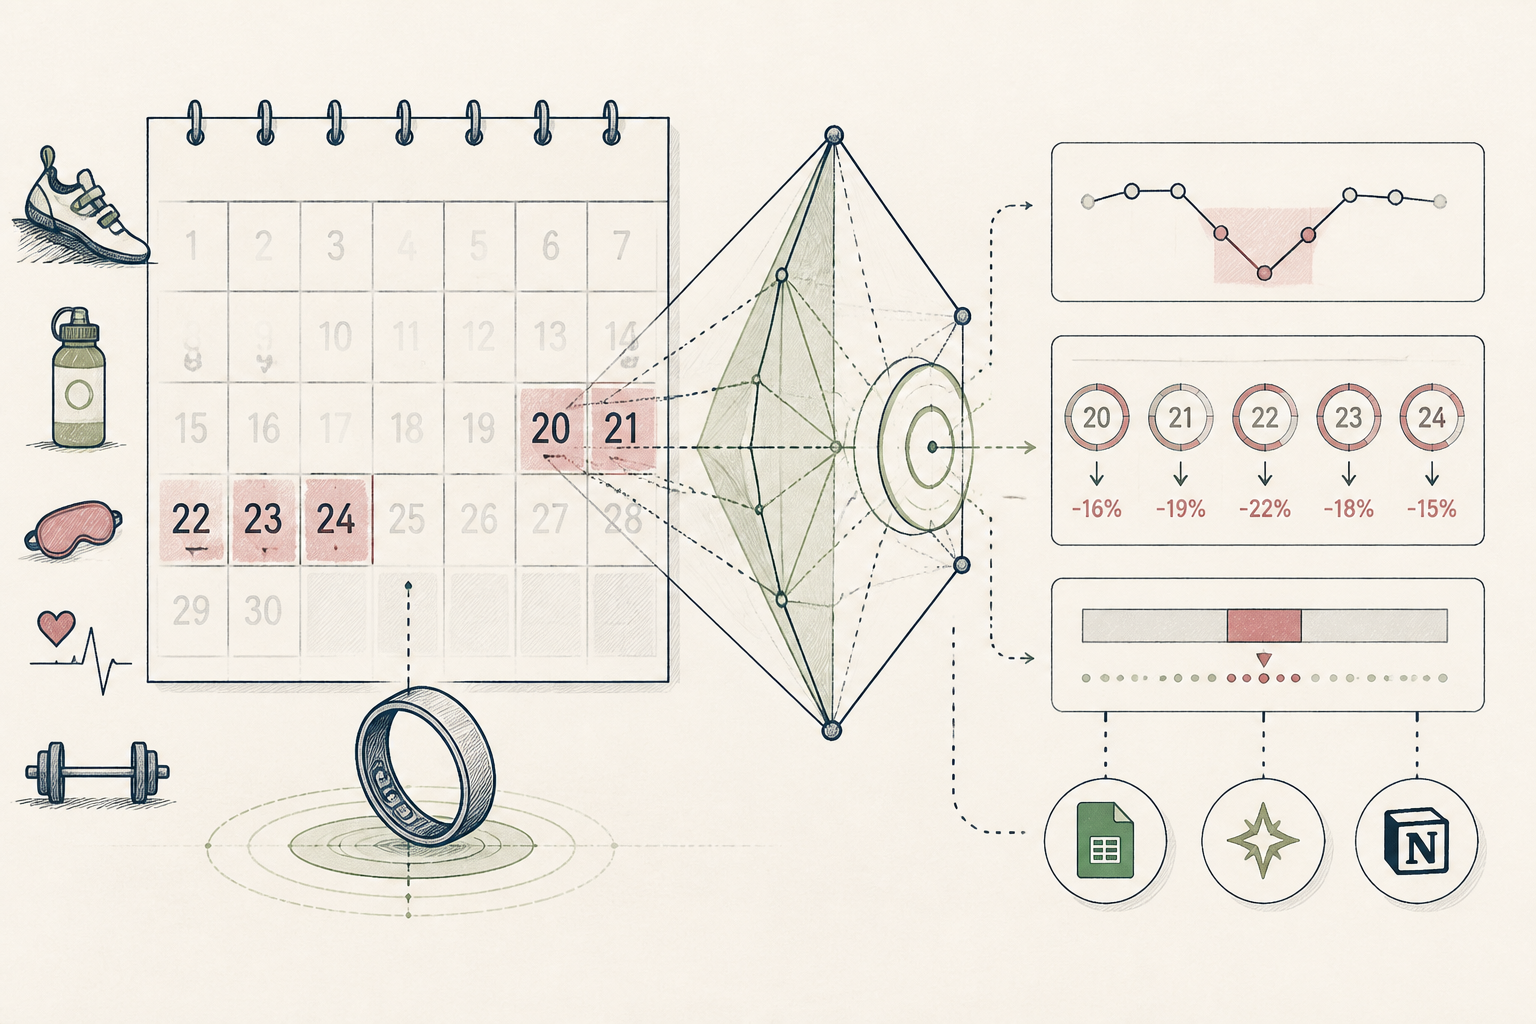
What the AI found
“Your recovery scores consistently dip by an average of 18% during days 20-24 of your cycle, indicating this is your lowest energetic phase, not days 1-3 as you’d assumed.”
Before
Vague cycle tracking, ignored recovery scores
After
Clear recovery patterns, proactive training adjustments
The same system, three states — real screens, not a screenshot
| Date | Cycle Day — Recovery Score |
| 2023-01-01 | 1 — 78 |
| 2023-01-02 | 2 — 81 |
| ... |
Prompt
Here is a year of my menstrual cycle data (1-28 days) and daily recovery scores (0-100). Please analyse if there are any consistent drops in recovery scores correlated with specific phases of my cycle. Provide specific cycle day ranges and average percentage drops if any exist. [PASTED GOOGLE SHEET DATA HERE]
Here is a year of my menstrual cycle data (1-28 days) and daily recovery scores (0-100). Please analyse if there are any consistent drops in recovery scores correlated with specific phases of my cycle. Provide specific cycle day ranges and average percentage drops if any exist. [PASTED GOOGLE SHEET DATA HERE]
AI
Upon analysing your data, I found a consistent and notable pattern: your recovery scores show a clear dip during cycle days 20-24. Specifically, the average recovery score in this period is 61, compared to your overall average of 74. This represents an average decrease of 18% during these days. There were no similarly significant or consistent drops identified during days 1-3.61
Avg. Recovery Score (Cycle Days 20-24)
74
Avg. Recovery Score (Other Days)
Jan 20-24
Predicted Low Recovery Window
The Discreet Cycles of an Amateur Climber
From hazy monthly records to a clear, actionable pattern in her recovery metrics, thanks to AI.
A 34-year-old amateur climber, Northern Europe
Tools used
The real tools used here — swap any for your own equivalent. Each links to how we’d set it up.
Starting state
Before anything was set up
For years, she diligently logged her menstrual cycle and daily recovery scores in separate apps, intending to find patterns. But the raw data, spread across multiple platforms, remained an unexamined jumble. Each month, the same frustration: plenty of numbers, but no clear insights into their connections or implications for her climbing.
| Date | Cycle Day — Recovery Score |
| 2023-01-01 | 1 — 78 |
| 2023-01-02 | 2 — 81 |
| ... | |
| 2023-12-31 | 28 — 76 |
Working state
Membership, doing its job
Facing a crucial climbing season, she decided to connect these disparate data points. She extracted a year's worth of cycle and recovery data, compiling it into a Google Sheet. Then, she opened her preferred AI assistant, pasted the combined data, and provided a precise prompt. The AI immediately began to cross-reference her cycle phases with her daily recovery trends, seeking the subtle correlations she’d always suspected were there but couldn't easily uncover herself.
Prompt
Here is a year of my menstrual cycle data (1-28 days) and daily recovery scores (0-100). Please analyse if there are any consistent drops in recovery scores correlated with specific phases of my cycle. Provide specific cycle day ranges and average percentage drops if any exist. [PASTED GOOGLE SHEET DATA HERE]
Here is a year of my menstrual cycle data (1-28 days) and daily recovery scores (0-100). Please analyse if there are any consistent drops in recovery scores correlated with specific phases of my cycle. Provide specific cycle day ranges and average percentage drops if any exist. [PASTED GOOGLE SHEET DATA HERE]
AI
Upon analysing your data, I found a consistent and notable pattern: your recovery scores show a clear dip during cycle days 20-24. Specifically, the average recovery score in this period is 61, compared to your overall average of 74. This represents an average decrease of 18% during these days. There were no similarly significant or consistent drops identified during days 1-3.Use case implemented
The finished system, running on its own
Now, with a clear understanding of her unique cyclical recovery patterns, she’s adjusted her training schedule. Instead of pushing hard throughout her cycle, she strategically plans her most intense climbing sessions for her peak energetic phases and dedicates days 20-24 to deloading and recovery. Her weekly review dashboard in Notion now reflects these insights, showing her predicted low-recovery window each month.
61
Avg. Recovery Score (Cycle Days 20-24)
74
Avg. Recovery Score (Other Days)
Jan 20-24
Predicted Low Recovery Window
What an outside observer would notice
down 15%
Average perceived exertion for key climbing workouts
up 20%
Consisteny of training according to plan
The stack — build it yourself
Familiar, flexible, and easy to export data from various sources into a single, structured format for AI analysis.
Its natural language processing capabilities allow for complex data queries without requiring coding, surfacing non-obvious correlations quickly.
Provides passive, reliable daily recovery metrics, reducing manual effort and increasing data consistency.
Highly customisable for displaying insights and integrating them into an actionable, proactive training and recovery schedule.
These are the tools used in this story. Any can be swapped for an equivalent you already trust.
Go deeper
Do this yourself
Explore more individual success stories
This story runs on Membership. The tools and prompts above are the real build — swap any tool for your own equivalent and follow the same steps.