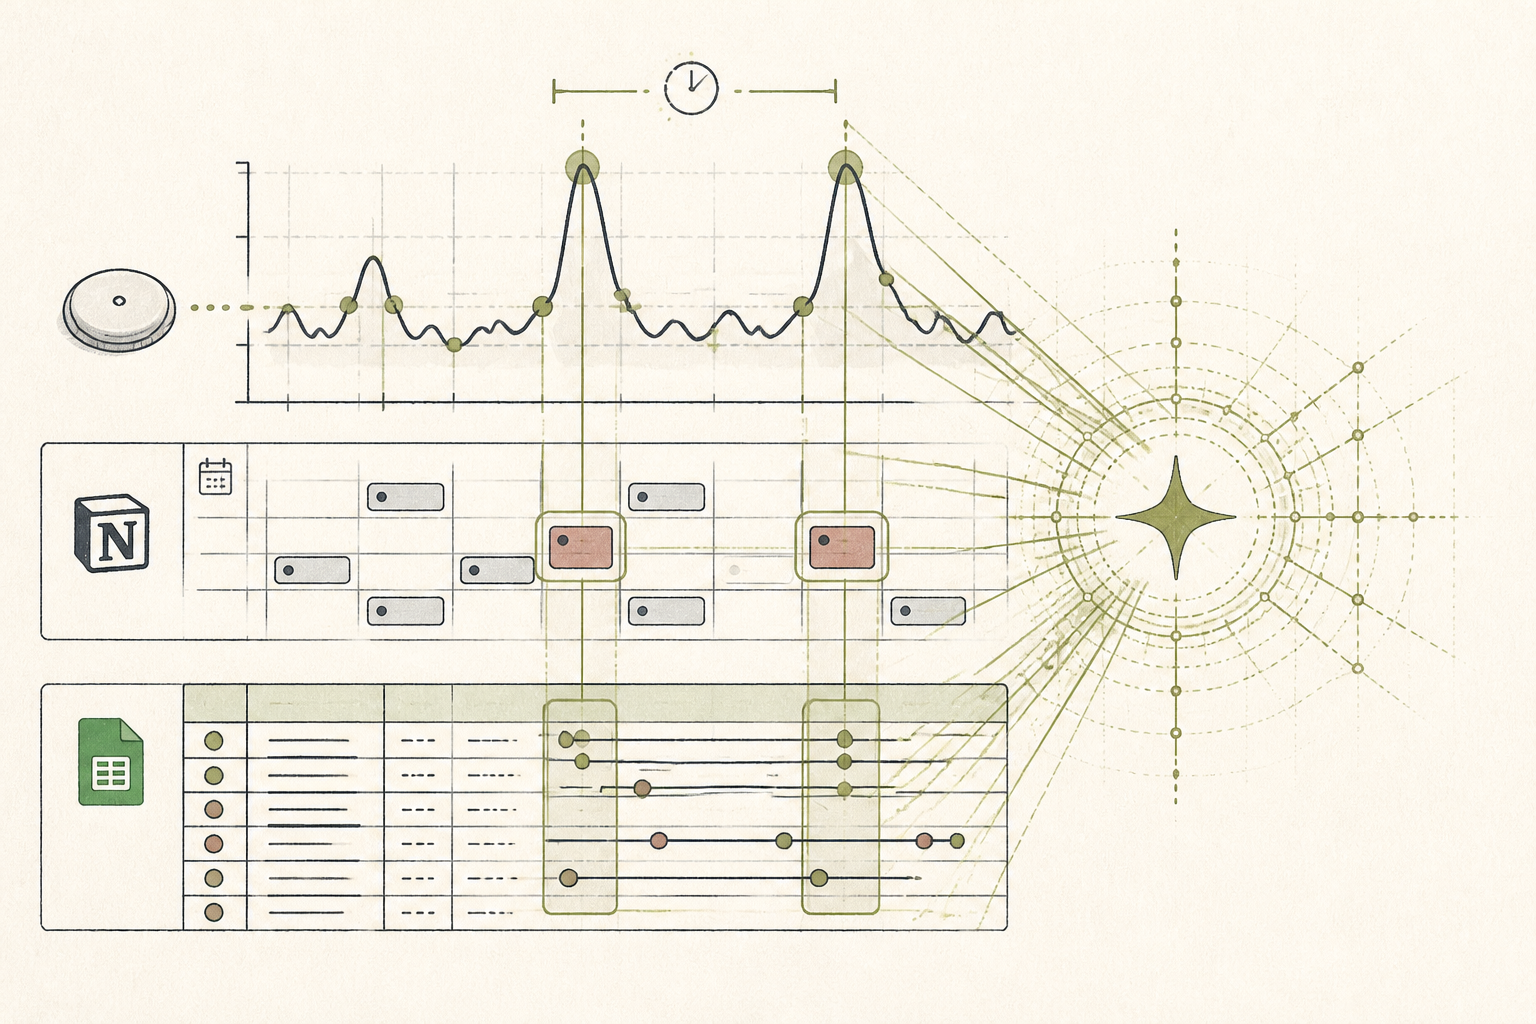
What the AI found
“The client's glucose spikes were not linked to carbohydrate volume, but to eating within forty minutes of high-stress client calls.”
Before
45 minutes parsing messy food photos
After
one clean pre-consult brief per client
The same system, three states — real screens, not a screenshot
| Client A | 14-day CSV attached (unreviewed) |
| Client B | 32 meal photos in chat log |
| Client C | calendar PDF exported without timestamps |
| Prep backlog | 3.5 hours remaining |
Prompt
Analyze this 14-day continuous glucose export alongside the client's work calendar. Identify correlations between glucose excursions above 140 mg/dL and external schedule variables.
Analyze this 14-day continuous glucose export alongside the client's work calendar. Identify correlations between glucose excursions above 140 mg/dL and external schedule variables.
AI
Analysis complete across 14 days and 48 total excursions. Surprising pattern: 71% of spikes above 140 mg/dL did not correlate with reported carbohydrate intake (>35g), but occurred within 40 minutes of calendar blocks marked 'Executive Review' or 'Board Update'—even on fasting or low-carb days.4 mins
Intake prep
Calendar + CGM
Context linked
14 sessions
Audit history
Synthesizing metabolic logs and client schedules in four minutes
How an independent nutritional therapist automated intake synthesis to spot hidden lifestyle patterns in minutes.
A private nutritional therapist running a solo clinic, EU
Tools used
The real tools used here — swap any for your own equivalent. Each links to how we’d set it up.
Starting state
Before anything was set up
Monday mornings began under an avalanche of disparate data. Clients emailed continuous glucose monitor exports as raw spreadsheets, dropped photos of lunch plates into messaging threads, and forwarded exported work calendars. The practitioner spent forty-five minutes per client simply reconciling timestamps across three browser tabs, trying to figure out why an otherwise compliant client experienced unexpected midday glucose rises.
| Client A | 14-day CSV attached (unreviewed) |
| Client B | 32 meal photos in chat log |
| Client C | calendar PDF exported without timestamps |
| Prep backlog | 3.5 hours remaining |
Working state
10-Day Challenge, doing its job
On Day 4 of the 10-Day Challenge, the practitioner unified client metrics into a two-column schema in Google Sheets: time-stamped glucose readings paired with exported calendar entries. Pasting the combined data into Claude with a standardized prompt, she tested the workflow. Within twenty seconds, the model isolated forty-eight distinct glucose rises and cross-referenced them with schedule tags.
Prompt
Analyze this 14-day continuous glucose export alongside the client's work calendar. Identify correlations between glucose excursions above 140 mg/dL and external schedule variables.
Analyze this 14-day continuous glucose export alongside the client's work calendar. Identify correlations between glucose excursions above 140 mg/dL and external schedule variables.
AI
Analysis complete across 14 days and 48 total excursions. Surprising pattern: 71% of spikes above 140 mg/dL did not correlate with reported carbohydrate intake (>35g), but occurred within 40 minutes of calendar blocks marked 'Executive Review' or 'Board Update'—even on fasting or low-carb days.Use case implemented
The finished system, running on its own
The practitioner now receives client data through a single structured intake template. During Tuesday morning prep, Claude runs an automated cross-reference script against the client's continuous glucose logs and exported calendar blocks. Instead of spending initial session minutes unpicking food diaries, consultations begin directly on behavioral context and daytime schedule adjustments. The practitioner remains entirely in control of clinical guidance, while the administrative legwork runs quietly in the background.
4 mins
Intake prep
Calendar + CGM
Context linked
14 sessions
Audit history
What an outside observer would notice
-82%
Chart prep time
14 per week
Contextual tags identified
The stack — build it yourself
Large context window handles combined 14-day continuous glucose exports alongside full calendar dumps easily.
Simple tabular structure that clients can populate without downloading bespoke third-party applications.
Consolidates automated analytical summaries into clean, persistent patient preparation templates.
These are the tools used in this story. Any can be swapped for an equivalent you already trust.
Go deeper
Do this yourself
Take the 10-Day Challenge
This story runs on 10-Day Challenge. The tools and prompts above are the real build — swap any tool for your own equivalent and follow the same steps.