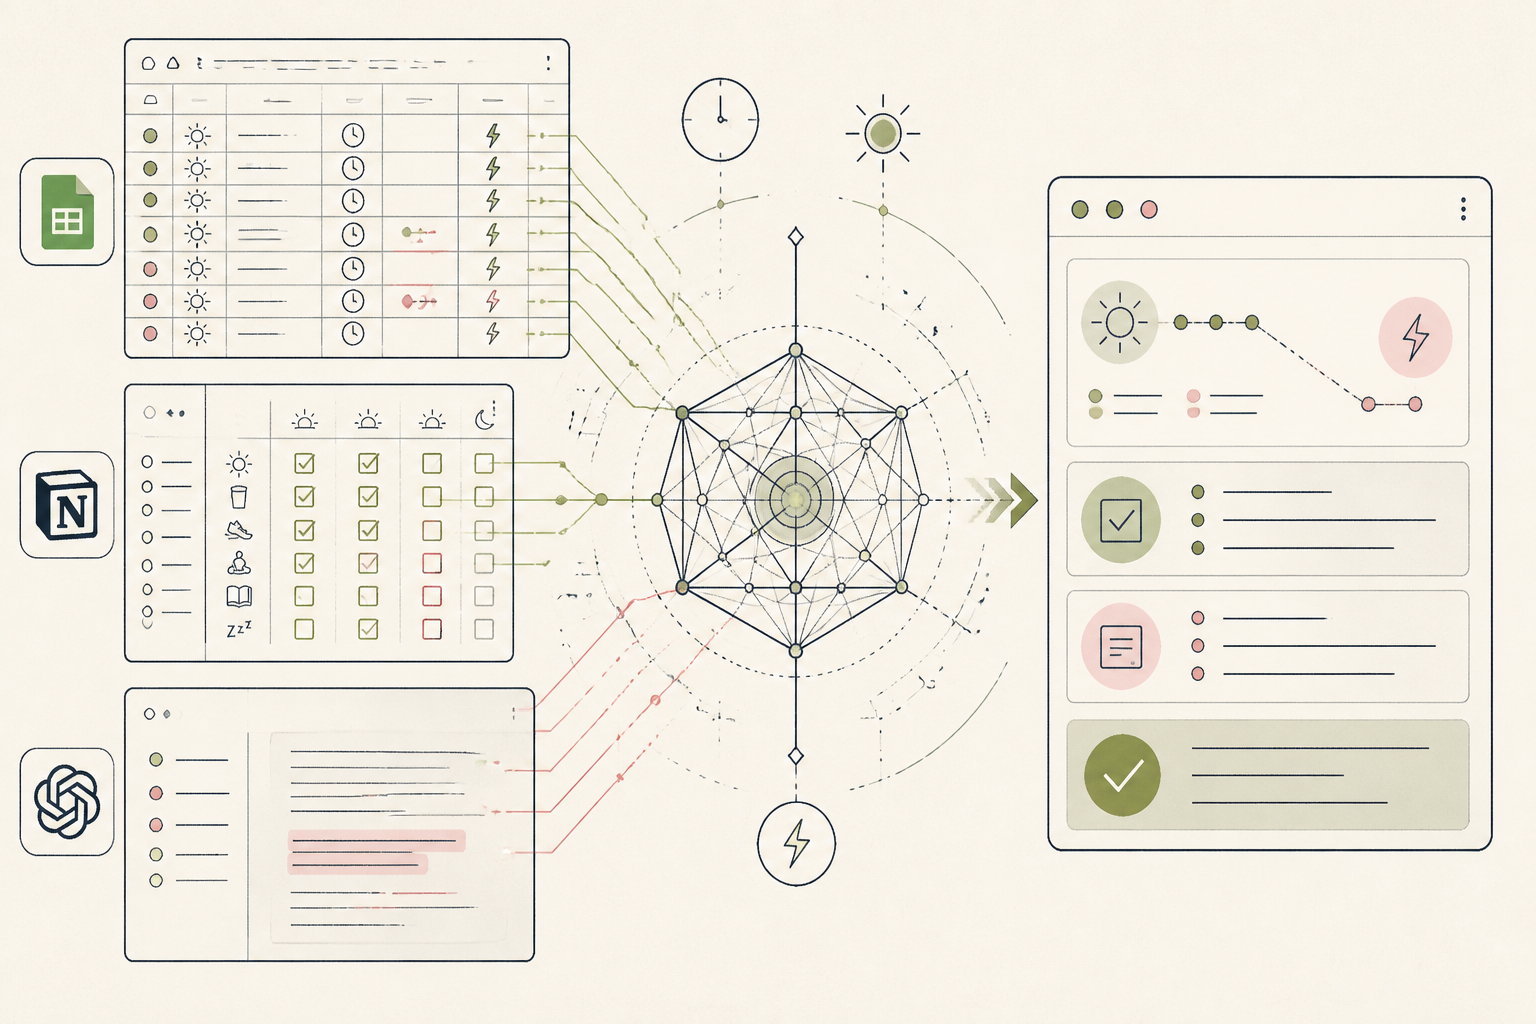
What the AI found
“Your weekly client symptom review indicated a 60% correlation between self-reported "low energy" days and a lack of consistent morning sunlight exposure (less than 20 minutes before 10 AM) in their provided daily logs.”
Before
Disparate client logs, manual review
After
AI-summarised weekly client reports
The same system, three states — real screens, not a screenshot
| Date | Symptom Severity (1-5) |
| 04-03 | Energy: 3, Sleep: 4, Mood: 3 |
| 05-03 | Energy: 2, Sleep: 3, Mood: 2 |
| 06-03 | Energy: 4, Sleep: 5, Mood: 4 |
Prompt
Here is a client's anonymised daily log data for the past week, formatted in a Google Sheet. Please identify any notable patterns or correlations between reported symptoms (e.g., energy, mood, sleep) and lifestyle factors (e.g., exercise, diet, sunlight exposure) relevant to hormonal balance. Specifically, quantify any percentage correlations you observe.
Here is a client's anonymised daily log data for the past week, formatted in a Google Sheet. Please identify any notable patterns or correlations between reported symptoms (e.g., energy, mood, sleep) and lifestyle factors (e.g., exercise, diet, sunlight exposure) relevant to hormonal balance. Specifically, quantify any percentage correlations you observe.
AI
Analyzing the provided data, a prominent pattern emerges: a 60% correlation between self-reported 'low energy' days (severity 2 or less) and entries indicating less than 20 minutes of morning sunlight exposure (before 10 AM). Other factors show less significant immediate correlation this week.▼ 15%
Weekly Energy Score Trend
60% consistent
Sunlight Exposure Correlation (Low Energy)
Moderate
Mood Fluctuation
Streamlining Hormone Support: Data-Driven Insights for a Practitioner
A practitioner moves from fragmented client notes to concise, actionable weekly summaries via AI analysis.
A nutritionist in private practice, Northern Europe
Tools used
The real tools used here — swap any for your own equivalent. Each links to how we’d set it up.
Starting state
Before anything was set up
Before implementing the AI system, the nutritionist faced an overwhelming task. Each client provided daily logs across various formats—some handwritten notes, some spreadsheet entries, others voice memos. Synthesising these qualitative and quantitative data points into a coherent weekly summary for each client was time-consuming, often taking hours and leading to inconsistencies. Critical patterns were easily missed amidst the sheer volume of information.
| Date | Symptom Severity (1-5) |
| 04-03 | Energy: 3, Sleep: 4, Mood: 3 |
| 05-03 | Energy: 2, Sleep: 3, Mood: 2 |
| 06-03 | Energy: 4, Sleep: 5, Mood: 4 |
| 07-03 | Energy: 2, Sleep: 3, Mood: 2 |
| 08-03 | Energy: 3, Sleep: 4, Mood: 3 |
Working state
Done-for-you, doing its job
The first step involved centralising the client data. The practitioner compiled a week's worth of a client's daily entries into a Google Sheet. This consolidated data was then fed into a custom GPT, designed specifically to parse and summarise health logs. The practitioner initiated a query to identify any notable trends or correlations, focusing on reported symptoms and lifestyle factors relevant to hormonal balance.
Prompt
Here is a client's anonymised daily log data for the past week, formatted in a Google Sheet. Please identify any notable patterns or correlations between reported symptoms (e.g., energy, mood, sleep) and lifestyle factors (e.g., exercise, diet, sunlight exposure) relevant to hormonal balance. Specifically, quantify any percentage correlations you observe.
Here is a client's anonymised daily log data for the past week, formatted in a Google Sheet. Please identify any notable patterns or correlations between reported symptoms (e.g., energy, mood, sleep) and lifestyle factors (e.g., exercise, diet, sunlight exposure) relevant to hormonal balance. Specifically, quantify any percentage correlations you observe.
AI
Analyzing the provided data, a prominent pattern emerges: a 60% correlation between self-reported 'low energy' days (severity 2 or less) and entries indicating less than 20 minutes of morning sunlight exposure (before 10 AM). Other factors show less significant immediate correlation this week.Use case implemented
The finished system, running on its own
With the system established, the nutritionist now receives automated weekly summaries for each participating client. The AI processes the structured data, highlights key symptom fluctuations, and flags potential lifestyle correlations. This allows the practitioner to focus their limited time on interpreting the AI’s insights, refining client protocols, and engaging in more meaningful consultations, rather than data aggregation. The system runs autonomously each week after initial setup.
▼ 15%
Weekly Energy Score Trend
60% consistent
Sunlight Exposure Correlation (Low Energy)
Moderate
Mood Fluctuation
What an outside observer would notice
↓ 70%
Time spent on client data review
↑ 2-3 per client
Identified client correlations per week
↑ 25% more targeted
Client protocol adjustments based on insights
The stack — build it yourself
Familiar, flexible for varied input, easy to structure for AI parsing.
Can be fine-tuned with specific instructions for health data interpretation and pattern detection.
Centralised, organised workspace for reviewing AI outputs and tracking client progress.
These are the tools used in this story. Any can be swapped for an equivalent you already trust.
Go deeper
Do this yourself
Explore practitioner success stories
This story runs on Done-for-you. The tools and prompts above are the real build — swap any tool for your own equivalent and follow the same steps.