What the AI found
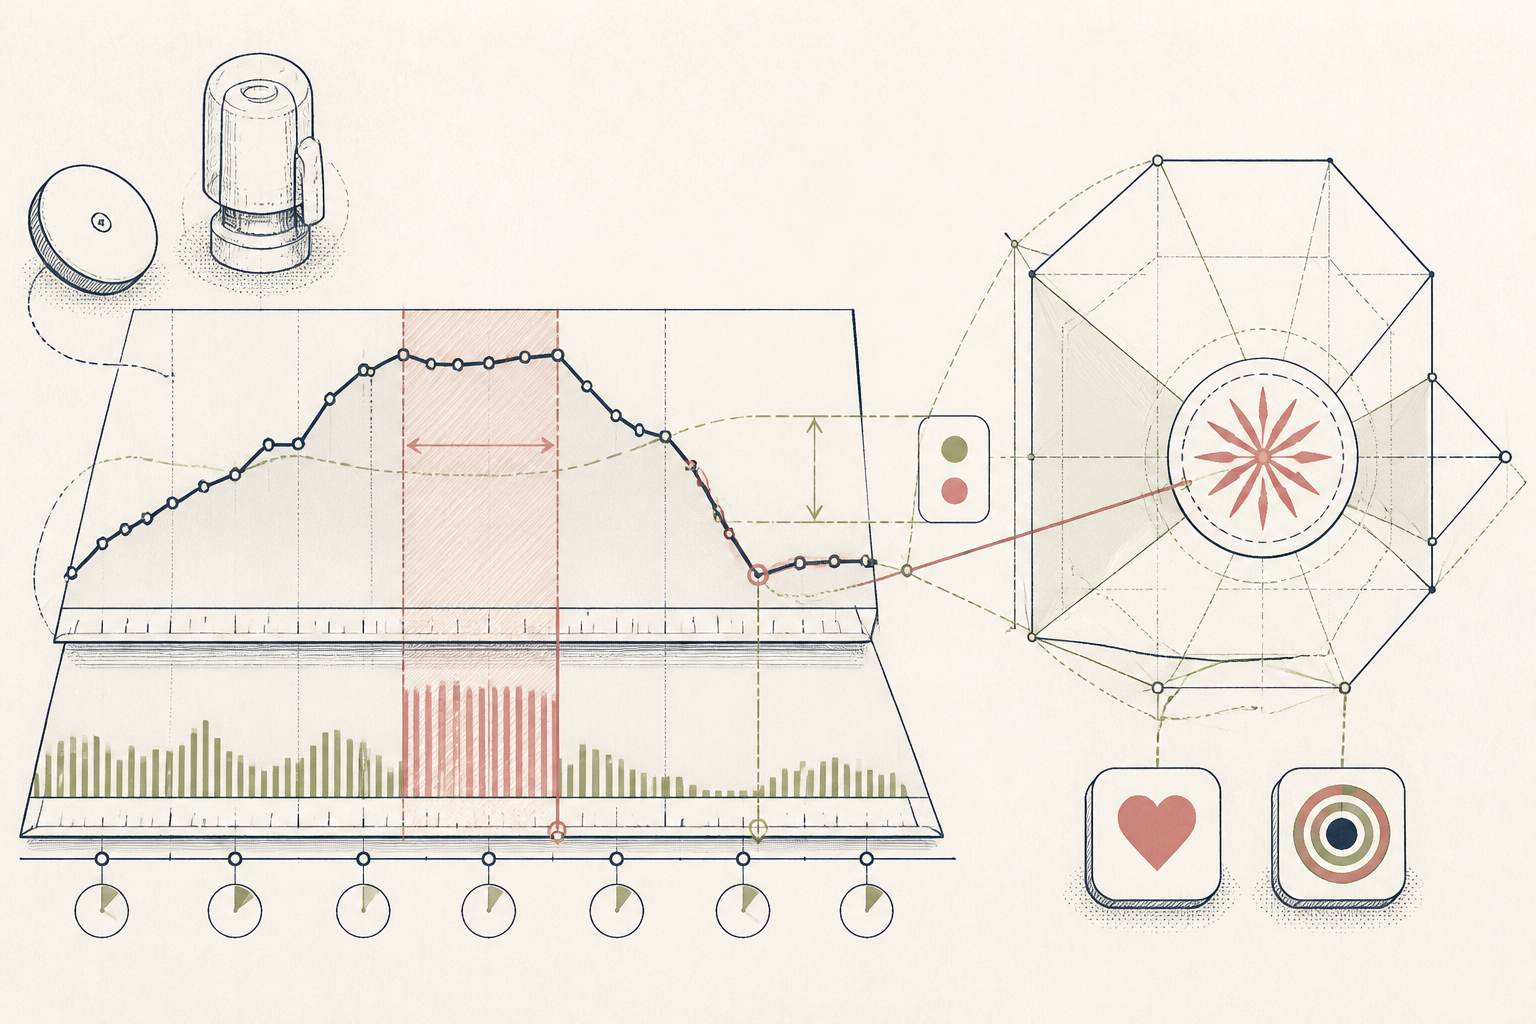
“Your afternoon slumps followed rapid 45-minute post-lunch walks, not desk-bound days; the exercise blunted the spike but caused a 2.1 mmol/L rebound drop by 3:15 PM.”
Before
A continuous monitor and zero usable conclusions
After
One Friday export, three predictable meal rules
The same system, three states — real screens, not a screenshot
| 2024-10-14 12 | 45 — 7.2 mmol/L (Post-quinoa bowl) |
| 2024-10-14 15 | 10 — 4.1 mmol/L (Severe brain fog note) |
| 2024-10-15 13 | 00 — 6.8 mmol/L (Post-salad + chicken) |
| 2024-10-15 15 | 20 — 4.3 mmol/L (Espresso required) |
Prompt
Here is my CSV export from LibreLink and my Apple Health step log for the past 28 days. Run the Metabolic Audit Playbook: correlate lunch timestamps, meal notes, step cadence within 60 minutes of eating, and my recorded low-energy notes around 3 PM. What specific variable separates high-alert afternoons from low-alert afternoons?
Here is my CSV export from LibreLink and my Apple Health step log for the past 28 days. Run the Metabolic Audit Playbook: correlate lunch timestamps, meal notes, step cadence within 60 minutes of eating, and my recorded low-energy notes around 3 PM. What specific variable separates high-alert afternoons from low-alert afternoons?
AI
Across 28 days, your average post-lunch peak is modest (6.9 mmol/L). However, on the 11 days you logged severe 3 PM fatigue, your step cadence between 1:00 PM and 2:00 PM exceeded 110 steps/min (brisk walk). This induced an average drop of 2.1 mmol/L within 45 minutes, bottoming at 4.1 mmol/L. On days with light movement (<60 steps/min), your glucose tapered gradually (0.6 mmol/L drop), and zero afternoon crashes were logged.0 recorded this week
Post-lunch rebound drops
8 / 10
3 PM alert level (self-rated)
4 minutes
Friday audit duration
Resolving the Afternoon Slump with a Structured Metabolic Audit
How a structured audit playbook turned four weeks of sensor noise into one actionable post-lunch movement rule.
A 38-year-old architectural consultant, EU
Tools used
The real tools used here — swap any for your own equivalent. Each links to how we’d set it up.
Starting state
Before anything was set up
Four weeks of continuous glucose monitor data sat in her inbox as raw CSV files. Every lunch produced a colourful squiggly line on her phone, accompanied by an anxious urge to check it every twenty minutes. She had tried eliminating sourdough, switching to grain bowls, and religiously pacing her hallway after eating. Despite the effort, her 3:15 PM mental fog remained chronic, and her spreadsheet of manual notes felt like homework with no answer key.
| 2024-10-14 12 | 45 — 7.2 mmol/L (Post-quinoa bowl) |
| 2024-10-14 15 | 10 — 4.1 mmol/L (Severe brain fog note) |
| 2024-10-15 13 | 00 — 6.8 mmol/L (Post-salad + chicken) |
| 2024-10-15 15 | 20 — 4.3 mmol/L (Espresso required) |
Working state
Resources, doing its job
She applied the Wellness & AI Metabolic Audit Resource. Rather than prompting the model with vague questions about nutrition, she ran the playbook's standardized prompt protocol in Claude. She uploaded her raw sensor CSV alongside her Apple Health step export. Within forty seconds, the model reconciled the misaligned timestamps, isolated the post-prandial windows, and ran a comparative rate-of-change analysis between her active and sedentary lunch hours.
Prompt
Here is my CSV export from LibreLink and my Apple Health step log for the past 28 days. Run the Metabolic Audit Playbook: correlate lunch timestamps, meal notes, step cadence within 60 minutes of eating, and my recorded low-energy notes around 3 PM. What specific variable separates high-alert afternoons from low-alert afternoons?
Here is my CSV export from LibreLink and my Apple Health step log for the past 28 days. Run the Metabolic Audit Playbook: correlate lunch timestamps, meal notes, step cadence within 60 minutes of eating, and my recorded low-energy notes around 3 PM. What specific variable separates high-alert afternoons from low-alert afternoons?
AI
Across 28 days, your average post-lunch peak is modest (6.9 mmol/L). However, on the 11 days you logged severe 3 PM fatigue, your step cadence between 1:00 PM and 2:00 PM exceeded 110 steps/min (brisk walk). This induced an average drop of 2.1 mmol/L within 45 minutes, bottoming at 4.1 mmol/L. On days with light movement (<60 steps/min), your glucose tapered gradually (0.6 mmol/L drop), and zero afternoon crashes were logged.Use case implemented
The finished system, running on its own
The system now runs entirely on Friday afternoons. An automated shortcut exports the weekly glucose CSV alongside Apple Health step counts into Claude using the same audit playbook prompt. There is no continuous gazing at real-time curves during meetings. The subject knows her personal threshold: a ten-minute stroll preserves alert afternoons, whereas power-walking right after lunch reliably brings an energy dip. She altered the timing of her outdoor walks without eliminating carbohydrates or purchasing specialized supplements.
0 recorded this week
Post-lunch rebound drops
8 / 10
3 PM alert level (self-rated)
4 minutes
Friday audit duration
What an outside observer would notice
4 mins (down from 45)
Weekly review time
1 day/week (down from 5)
3 PM subjective energy crash
The stack — build it yourself
Exports clean, unadorned CSV data of continuous interstitial glucose readings.
Provides native timestamped movement data without requiring a third-party subscription.
Handles long-context tabular data and accurately cross-references disparate timestamps without hallucination.
These are the tools used in this story. Any can be swapped for an equivalent you already trust.
Go deeper
Do this yourself
Explore the metabolic audit playbook
This story runs on Resources. The tools and prompts above are the real build — swap any tool for your own equivalent and follow the same steps.