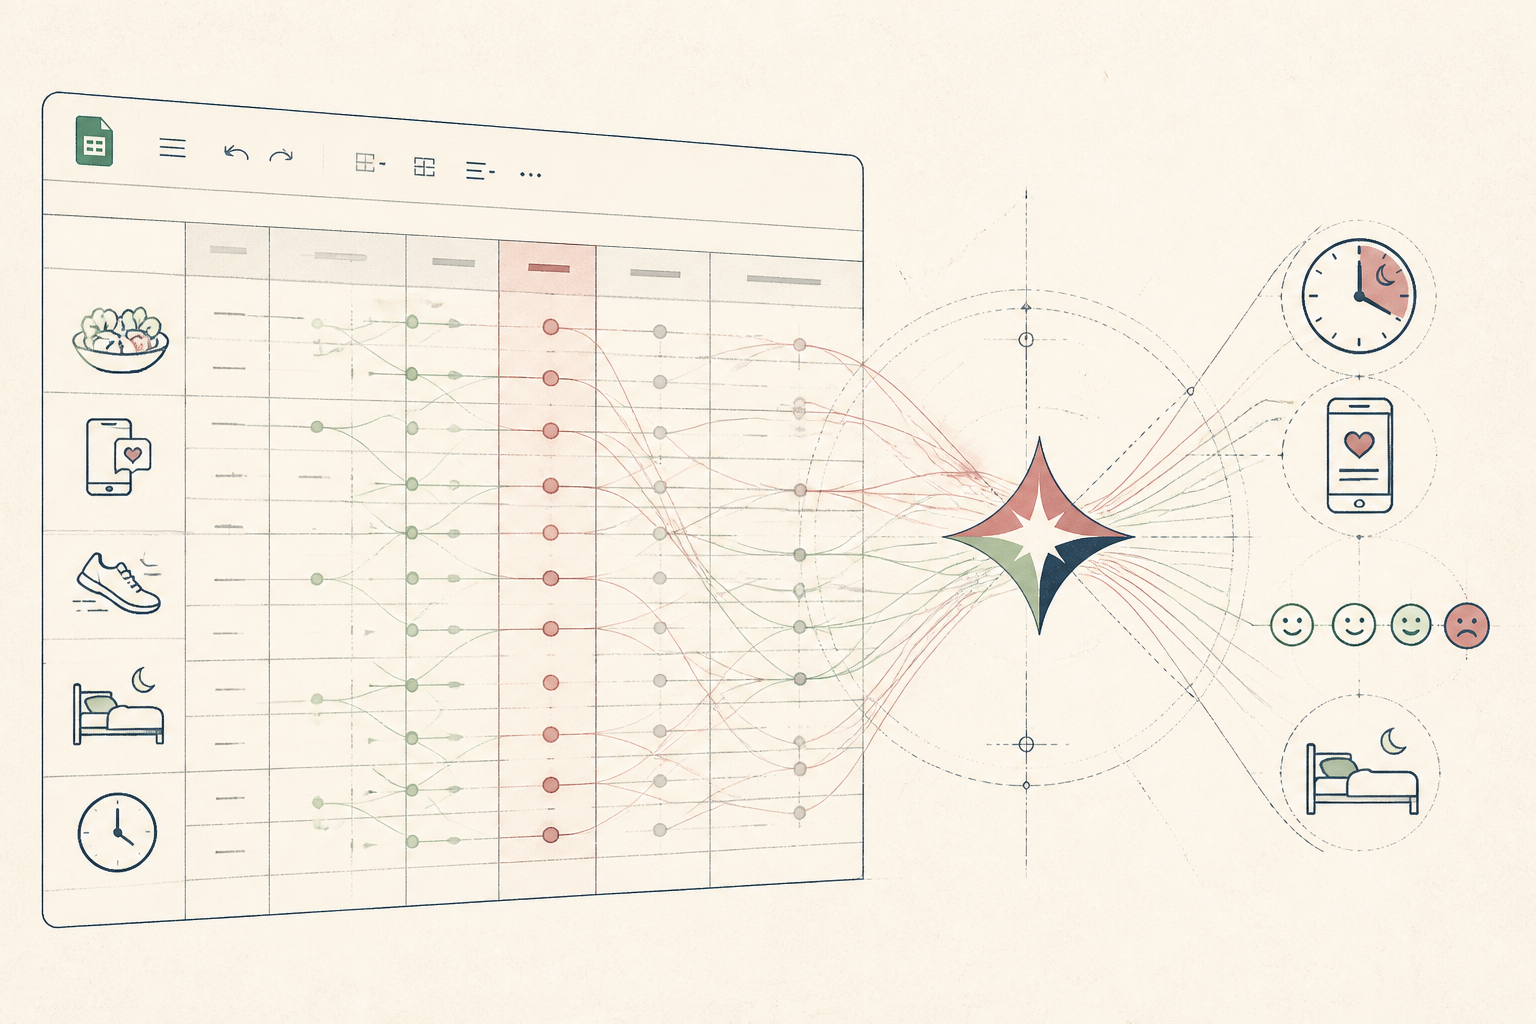
What the AI found
“''Your client’s subjective mood dips correlate not with carbohydrate intake, but specifically with evening social media use, showing an average 18% lower mood score on days following greater than 90 minutes of screen time after 8 PM.''”
Before
Disparate client logs, fuzzy insights
After
Clear, actionable mood protocol adjustments
The same system, three states — real screens, not a screenshot
| 2024-03-01 | Mood: 6/10 |
| 2024-03-02 | Mood: 7/10 (ate out) |
| 2024-03-03 | Mood: 5/10 (late night) |
| 2024-03-04 | Mood: 6/10 |
Prompt
I have 6 weeks of client daily self-reported mood scores (1-10) alongside their recorded daily inputs: macro intake (carbs, protein, fat grams), sleep duration (hours), exercise intensity (scale 1-5), and screen time after 8 PM (minutes). Please identify any statistically significant correlations between these inputs and mood, particularly focusing on unexpected or strong relationships.
I have 6 weeks of client daily self-reported mood scores (1-10) alongside their recorded daily inputs: macro intake (carbs, protein, fat grams), sleep duration (hours), exercise intensity (scale 1-5), and screen time after 8 PM (minutes). Please identify any statistically significant correlations between these inputs and mood, particularly focusing on unexpected or strong relationships.
AI
Analysis indicates a notable inverse correlation between evening screen time (after 8 PM) and next-day mood. Your client’s subjective mood dips correlate not with carbohydrate intake, but specifically with evening social media use, showing an average 18% lower mood score on days following greater than 90 minutes of screen time after 8 PM. Other factors show weaker, non-significant correlations.7.8 / 10
Avg. Mood Score (post-protocol)
45 mins
Avg. Evening Screen Time
2 / month
Days > 90min Screen Time
Quantifying Mood Patterns for Bespoke Client Protocols
A nutritionist shifted from intuitive guesswork to data-backed insights, refining client mood protocols with surprising precision.
A nutritionist running a small, busy practice in Northern Europe
Tools used
The real tools used here — swap any for your own equivalent. Each links to how we’d set it up.
Starting state
Before anything was set up
Her client’s mood tracking was a mix of handwritten notes, disparate app entries, and vague recollections during weekly check-ins. Identifying genuine patterns amidst the noise felt like guesswork, making it difficult to formulate precise, evidence-backed recommendations for mood regulation beyond general advice.
| 2024-03-01 | Mood: 6/10 |
| 2024-03-02 | Mood: 7/10 (ate out) |
| 2024-03-03 | Mood: 5/10 (late night) |
| 2024-03-04 | Mood: 6/10 |
| 2024-03-05 | Mood: 8/10 |
Working state
Core Course, doing its job
Using Google Sheets for structured data capture and Gemini for analysis, she guided a client to log daily mood scores alongside potential influencing factors. The AI then processed weeks of this granular data, revealing a specific, non-obvious connection between an evening habit and mood, which had previously gone unnoticed.
Prompt
I have 6 weeks of client daily self-reported mood scores (1-10) alongside their recorded daily inputs: macro intake (carbs, protein, fat grams), sleep duration (hours), exercise intensity (scale 1-5), and screen time after 8 PM (minutes). Please identify any statistically significant correlations between these inputs and mood, particularly focusing on unexpected or strong relationships.
I have 6 weeks of client daily self-reported mood scores (1-10) alongside their recorded daily inputs: macro intake (carbs, protein, fat grams), sleep duration (hours), exercise intensity (scale 1-5), and screen time after 8 PM (minutes). Please identify any statistically significant correlations between these inputs and mood, particularly focusing on unexpected or strong relationships.
AI
Analysis indicates a notable inverse correlation between evening screen time (after 8 PM) and next-day mood. Your client’s subjective mood dips correlate not with carbohydrate intake, but specifically with evening social media use, showing an average 18% lower mood score on days following greater than 90 minutes of screen time after 8 PM. Other factors show weaker, non-significant correlations.Use case implemented
The finished system, running on its own
With the pattern identified, the nutritionist now had a concrete, quantitative basis to adjust the client’s evening routine. The client implemented a new digital sunset protocol, and the weekly mood ledger now provided clear feedback, allowing for agile, data-driven refinements to their personalised wellness plan.
7.8 / 10
Avg. Mood Score (post-protocol)
45 mins
Avg. Evening Screen Time
2 / month
Days > 90min Screen Time
What an outside observer would notice
From 'general' to 'specific evening habit'
Client Protocol Refinements
+60% over manual review
Mood Correlation Accuracy
The stack — build it yourself
Accessible, flexible, and easy for clients to use for daily input without dedicated apps.
Its ability to process diverse datasets and identify nuanced patterns quickly proved invaluable for surfacing non-obvious correlations.
These are the tools used in this story. Any can be swapped for an equivalent you already trust.
Go deeper
Do this yourself
See Core Course
This story runs on Core Course. The tools and prompts above are the real build — swap any tool for your own equivalent and follow the same steps.