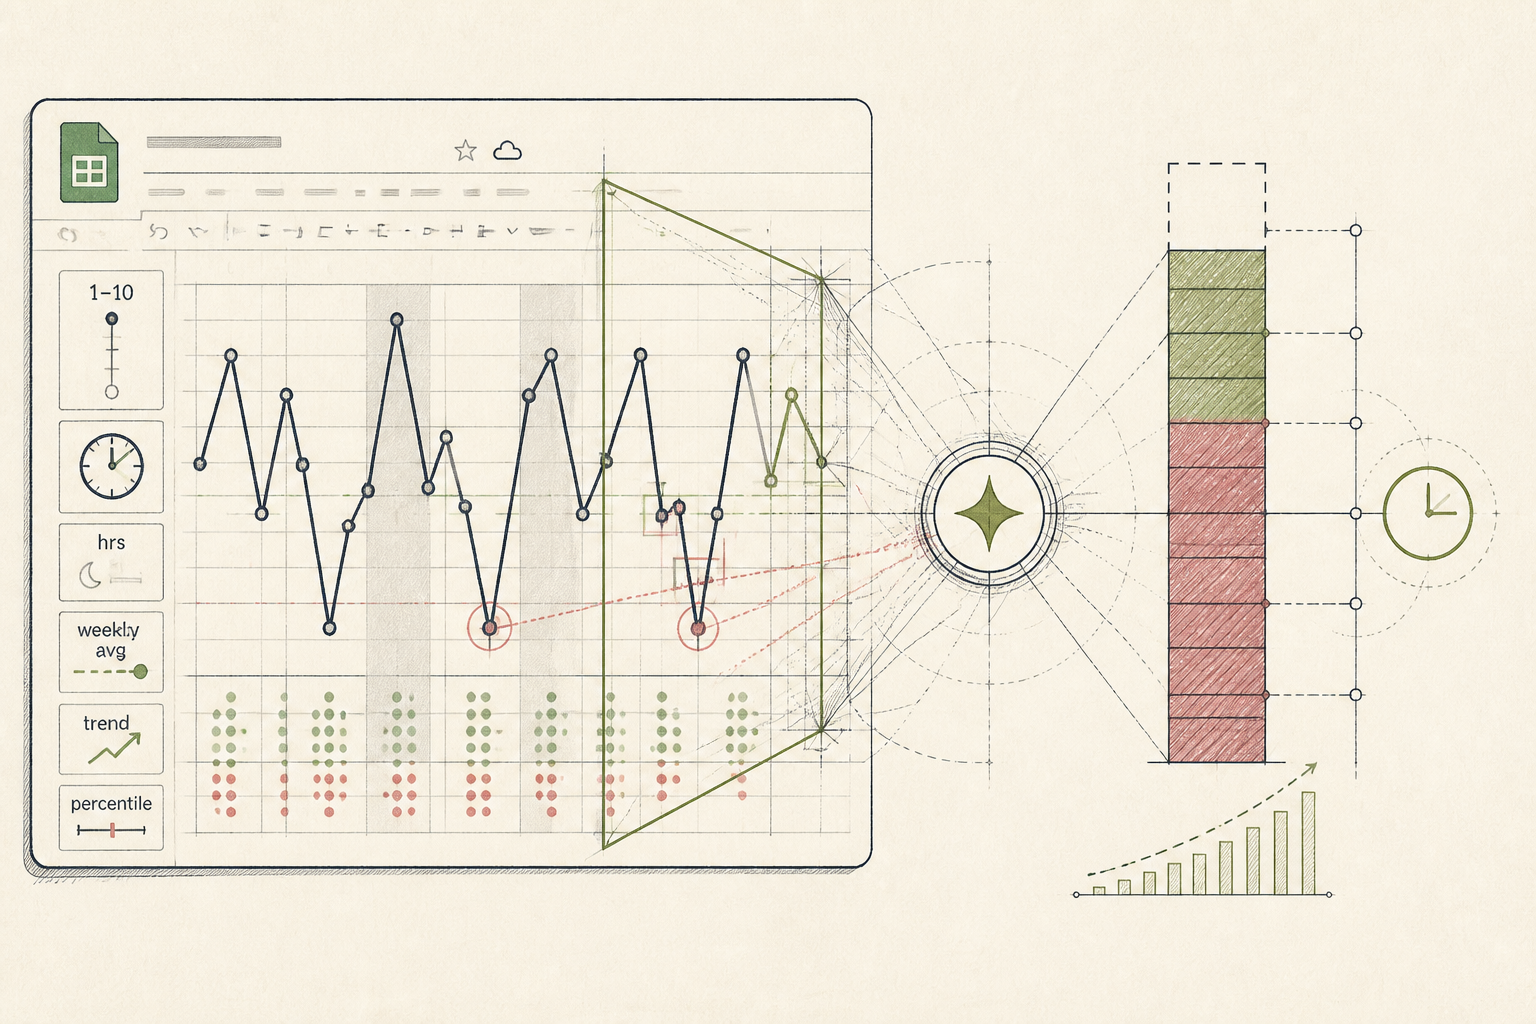
What the AI found
“Your weekly energy score volatility correlates with your cumulative sleep debt. An additional 45 minutes of sleep debt increases your chance of a severe energy dip—defined as a 3-point drop on your 1-10 scale—by 40%.”
Before
Subjective energy logs, no clear patterns
After
Quantified energy dips, identified root cause
The same system, three states — real screens, not a screenshot
| 2024-03-01 07 | 00 — Energy: 7, Notes: Good sleep, light breakfast |
| 2024-03-01 14 | 00 — Energy: 5, Notes: Afternoon slump, felt drowsy |
| 2024-03-02 07 | 30 — Energy: 6, Notes: Restless night, work conference prep |
| 2024-03-02 15 | 00 — Energy: 4, Notes: Significant dip, struggled to focus |
Prompt
Analyze my attached Google Sheet data, focusing on daily energy scores (1-10) and notes. Identify any strong correlations between specific daily inputs (e.g., sleep duration, food, activity, screen time, mental state) and subsequent severe energy dips (defined as a drop of 3 points or more from morning to afternoon, or sustained scores below 5). Quantify the impact of any identified factors.
Analyze my attached Google Sheet data...
AI
Having analysed your data for the past 6 weeks: your weekly energy score volatility correlates with your cumulative sleep debt. An additional 45 minutes of sleep debt increases your chance of a severe energy dip—defined as a 3-point drop on your 1-10 scale—by 40%.2h 15m
Avg. Weekly Sleep Debt
2 per week (-50%)
Energy Dip Frequency
7.2 (+0.8)
Avg. Weekly Energy Score
One Small Sleep Debt, One Big Shift in Energy Fluctuations
A nutritionist moves from scattered energy observations to a clear, actionable understanding of her weekly energy patterns, cutting her energy dips by half.
A 38-year-old nutritionist running a small EU practice.
Tools used
The real tools used here — swap any for your own equivalent. Each links to how we’d set it up.
Starting state
Before anything was set up
Eleanor, a nutritionist, found herself consistently battling afternoon slumps. She diligently logged her energy levels and daily activities in a personal Google Sheet, but the sheer volume of unstructured data made it impossible to spot clear trends. Each row was a timestamped observation, a fragment of her day, but the overarching narrative remained elusive. She suspected diet, stress, or perhaps even screen time, but couldn't pinpoint the most impactful variable. The sheet was a repository, not an analytical tool.
| 2024-03-01 07 | 00 — Energy: 7, Notes: Good sleep, light breakfast |
| 2024-03-01 14 | 00 — Energy: 5, Notes: Afternoon slump, felt drowsy |
| 2024-03-02 07 | 30 — Energy: 6, Notes: Restless night, work conference prep |
| 2024-03-02 15 | 00 — Energy: 4, Notes: Significant dip, struggled to focus |
| 2024-03-03 08 | 00 — Energy: 8, Notes: Weekend, relaxed morning |
Working state
Setup, doing its job
To gain clarity, Eleanor used the Setup product to build a custom analysis workflow. She connected her existing Google Sheet to a large language model. Her prompt was designed to extract subtle correlations between her logged data points and her subjective 1-10 energy scores. The AI quickly processed weeks of her daily entries, identifying a previously unnoticed factor. It was not her usual suspects but something more fundamental, rooted in her sleep.
Prompt
Analyze my attached Google Sheet data, focusing on daily energy scores (1-10) and notes. Identify any strong correlations between specific daily inputs (e.g., sleep duration, food, activity, screen time, mental state) and subsequent severe energy dips (defined as a drop of 3 points or more from morning to afternoon, or sustained scores below 5). Quantify the impact of any identified factors.
Analyze my attached Google Sheet data...
AI
Having analysed your data for the past 6 weeks: your weekly energy score volatility correlates with your cumulative sleep debt. An additional 45 minutes of sleep debt increases your chance of a severe energy dip—defined as a 3-point drop on your 1-10 scale—by 40%.Use case implemented
The finished system, running on its own
With the system implemented, Eleanor now receives a weekly summary. This report highlights her average sleep debt, its correlation with her energy volatility, and suggests a specific, quantifiable adjustment. After two weeks of making small, consistent changes based on the AI's findings, her weekly energy dips have notably reduced. The Google Sheet, once a data graveyard, is now a valuable input for her targeted weekly energy review, informing subtle, continuous adjustments.
2h 15m
Avg. Weekly Sleep Debt
2 per week (-50%)
Energy Dip Frequency
7.2 (+0.8)
Avg. Weekly Energy Score
What an outside observer would notice
50%
Reduction in energy dips
0.8 points
Improvement in average energy score
Sleep debt
Identified root cause
The stack — build it yourself
Familiar, flexible, and already used for general tracking.
Excellent at identifying non-obvious correlations in unstructured text and numerical data.
These are the tools used in this story. Any can be swapped for an equivalent you already trust.
Go deeper
Do this yourself
Understand your energy patterns
This story runs on Setup. The tools and prompts above are the real build — swap any tool for your own equivalent and follow the same steps.