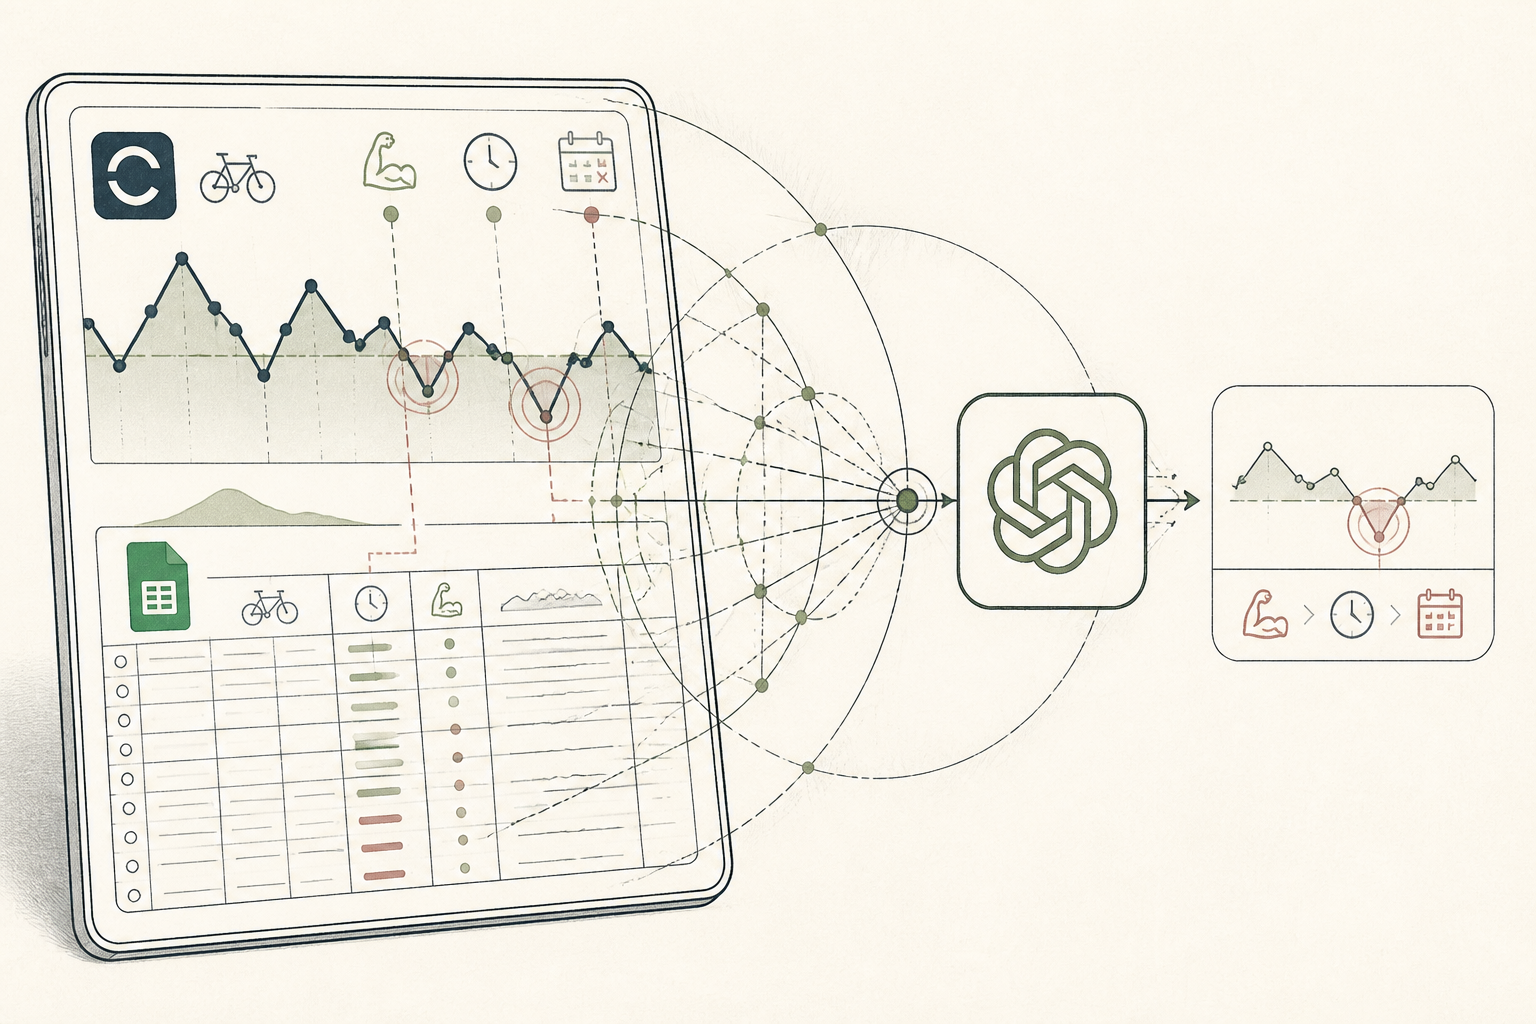
What the AI found
“Your average long-ride power output consistently dropped by 18 watts when you performed core strength training within 24 hours of a long-distance cycling session. This correlation was not observed with other strength training types.”
Before
Ad-hoc training, inconsistent performance
After
Targeted conditioning, 18W average power gain
The same system, three states — real screens, not a screenshot
| Date | Activity — Duration — AvgPower — MaxHR — Notes |
| 2023-10-21 | Long Ride — 3h 15m — 210W — 168bpm — Felt sluggish |
| 2023-10-20 | Core Strength — 45m — N/A — N/A — Plank, Russian twists |
| 2023-10-18 | Interval Ride — 1h — 250W — 180bpm — Good session |
Prompt
Analyze the attached cycling power data and strength training logs. Quantify the impact of different strength training types (core, legs, upper body) on average power output during subsequent long-distance cycling sessions (>2 hours). Identify any statistically significant correlations or negative impacts.
Can you analyse my training logs for patterns between strength work and ride performance?
AI
After reviewing your data, a notable trend emerges: your average long-ride power output consistently dropped by 18 watts when you performed core strength training within 24 hours of a long-distance cycling session. This specific correlation was not observed with other strength training types like legs or upper body, suggesting a direct, short-term impact of core fatigue on endurance performance.228 W
Avg. Long Ride Power
48 hrs (min)
Core-Ride Gap
+12%
Long Ride Consistency
One Small Change, Big Impact on Cycling Stamina
An amateur cyclist used AI to pinpoint a single, overlooked variable impacting his long-ride performance, shifting from guesswork to targeted conditioning.
A 41-year-old amateur cyclist, Northern Europe
Tools used
The real tools used here — swap any for your own equivalent. Each links to how we’d set it up.
Starting state
Before anything was set up
Our cyclist, Julian, tracked his rides diligently, but his strength training was a mix of memory and popular routines picked up online. He knew core strength was important for cycling, but he hadn't seen a clear link between his gym sessions and his weekend long-distance rides. Often, he felt strong in the gym, only to underperform on the road. His data was spread across a few apps, making comparative analysis a tedious task he rarely completed.
| Date | Activity — Duration — AvgPower — MaxHR — Notes |
| 2023-10-21 | Long Ride — 3h 15m — 210W — 168bpm — Felt sluggish |
| 2023-10-20 | Core Strength — 45m — N/A — N/A — Plank, Russian twists |
| 2023-10-18 | Interval Ride — 1h — 250W — 180bpm — Good session |
| 2023-10-17 | Leg Strength — 1h — N/A — N/A — Squats, lunges |
Working state
Resources, doing its job
He started by exporting his ride data and training logs into a simple spreadsheet. Using a new AI platform, he uploaded his consolidated data and, using a provided template, asked for an analysis of how different strength training types affected his subsequent long-distance cycling power output. The AI processed weeks of granular ride and workout data, a task that would have taken him hours to do manually, if at all.
Prompt
Analyze the attached cycling power data and strength training logs. Quantify the impact of different strength training types (core, legs, upper body) on average power output during subsequent long-distance cycling sessions (>2 hours). Identify any statistically significant correlations or negative impacts.
Can you analyse my training logs for patterns between strength work and ride performance?
AI
After reviewing your data, a notable trend emerges: your average long-ride power output consistently dropped by 18 watts when you performed core strength training within 24 hours of a long-distance cycling session. This specific correlation was not observed with other strength training types like legs or upper body, suggesting a direct, short-term impact of core fatigue on endurance performance.Use case implemented
The finished system, running on its own
With the AI's insight, Julian adjusted his training schedule, ensuring at least 48 hours between core strength workouts and long-distance rides. This simple, data-backed change led to an immediate and noticeable improvement in his cycling endurance and power. He now uses the system for quarterly reviews, effortlessly integrating AI insights into his ongoing training adjustments, focusing precisely where the data guides him.
228 W
Avg. Long Ride Power
48 hrs (min)
Core-Ride Gap
+12%
Long Ride Consistency
What an outside observer would notice
Up 18 watts
Average Long-Ride Power Output
Core-ride gap: 48h
Training Schedule Adaption
More consistent
Subjective Ride Quality
The stack — build it yourself
Reliable and automatic capture of cycling power, heart rate, and GPS data from his Garmin Edge device.
Flexible cloud-based spreadsheet for combining ride data and manual strength training logs into a single, clean dataset for analysis.
Advanced natural language processing to identify subtle, complex patterns and quantify correlations across disparate training variables.
These are the tools used in this story. Any can be swapped for an equivalent you already trust.
Go deeper
Do this yourself
See Resources
This story runs on Resources. The tools and prompts above are the real build — swap any tool for your own equivalent and follow the same steps.