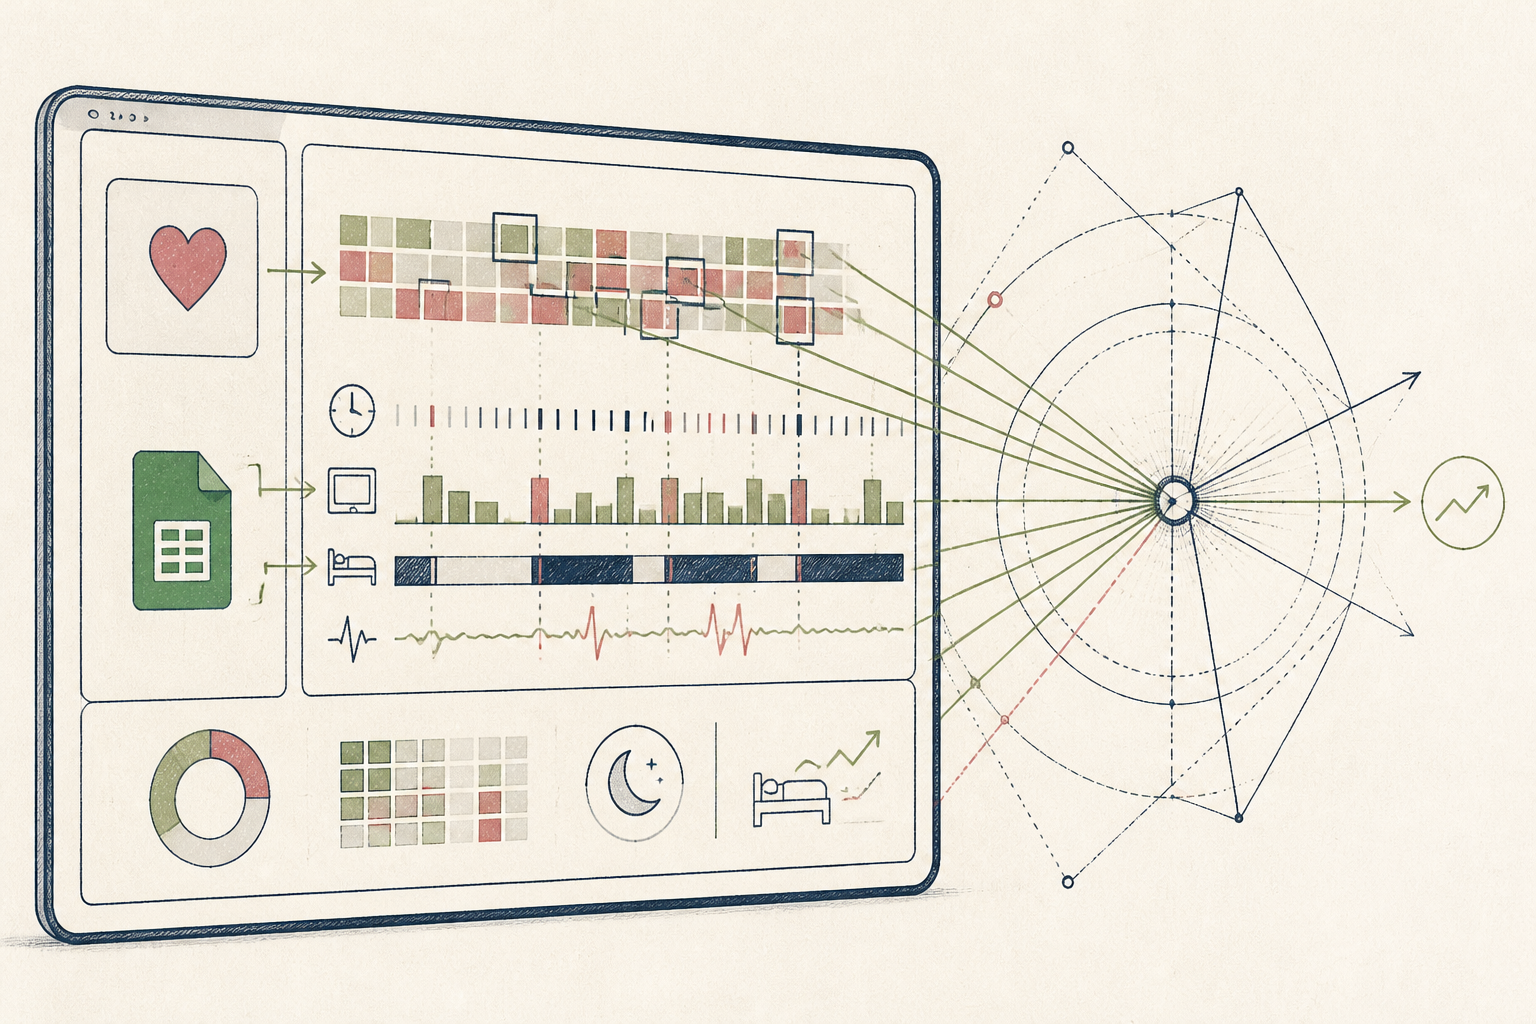
What the AI found
“Your sleep quality dips significantly (avg. 1.2 points on a 10-point scale) on nights following late-evening high-intensity screen time, regardless of bedtime.”
Before
Raw sleep data, no clear patterns, no adjustments
After
Actionable sleep insights, guiding daily habits
The same system, three states — real screens, not a screenshot
| Time in Bed | 7h 45m |
| Sleep Duration | 7h 02m |
| Deep Sleep | 1h 10m |
| REM Sleep | 1h 48m |
Prompt
I have one week of daily sleep data (duration, deep sleep, REM, quality, HRV) and corresponding daily notes on my evening activities (e.g., 'light reading', 'high-intensity screen time', 'exercise before 6pm', 'late meal'). Analyse this data to identify any correlations between my evening activities and my overall sleep quality score. Focus on surprising or non-obvious patterns.
I have one week of daily sleep data (duration, deep sleep, REM, quality, HRV) and corresponding daily notes on my evening activities (e.g., 'light reading', 'high-intensity screen time', 'exercise before 6pm', 'late meal'). Analyse this data to identify any correlations between my evening activities and my overall sleep quality score. Focus on surprising or non-obvious patterns.
AI
Analysis indicates a significant inverse correlation: your sleep quality score drops by an average of 1.2 points on days where you reported 'high-intensity screen time' after 9 PM. This effect is more pronounced than late meals or exercise timing.↑ 0.5 points
Weekly Sleep Quality Trend
↓ 7% variability
HRV Consistency
↓ 2 sessions/week
Evenings with Late Screen Time
One simple prompt surfaces unexpected longevity insights from sleep data
A brief, daily routine transforms overwhelming sleep data into actionable weekly patterns.
A 54-year-old software engineer, Northern Europe
Tools used
The real tools used here — swap any for your own equivalent. Each links to how we’d set it up.
Starting state
Before anything was set up
For years, John had faithfully tracked his sleep with a wearable device, accumulating vast quantities of data points: time in bed, duration, stages, heart rate variability, and more. He knew the data was valuable, but it remained a sprawling, undifferentiated mass. Without a clear method to parse it, he found himself simply observing trends without understanding their causes or implications. The information was all there, yet it felt inaccessible, failing to translate into meaningful improvements for his longevity goals.
| Time in Bed | 7h 45m |
| Sleep Duration | 7h 02m |
| Deep Sleep | 1h 10m |
| REM Sleep | 1h 48m |
| Sleep Quality | 7.8 |
| HRV | 58 ms |
Working state
10-Day Challenge, doing its job
Following the 10-Day Challenge, John imported a week's worth of sleep metrics into a spreadsheet and then copied that raw data into his AI assistant. His prompt requested a comparison of sleep quality against daily habits, looking for correlations. The AI processed the information, quickly identifying a subtle, recurring pattern John had completely overlooked. It wasn't just about bedtime, but the *type* of activity before sleep that impacted his metrics significantly. This was the moment the raw data began to speak.
Prompt
I have one week of daily sleep data (duration, deep sleep, REM, quality, HRV) and corresponding daily notes on my evening activities (e.g., 'light reading', 'high-intensity screen time', 'exercise before 6pm', 'late meal'). Analyse this data to identify any correlations between my evening activities and my overall sleep quality score. Focus on surprising or non-obvious patterns.
I have one week of daily sleep data (duration, deep sleep, REM, quality, HRV) and corresponding daily notes on my evening activities (e.g., 'light reading', 'high-intensity screen time', 'exercise before 6pm', 'late meal'). Analyse this data to identify any correlations between my evening activities and my overall sleep quality score. Focus on surprising or non-obvious patterns.
AI
Analysis indicates a significant inverse correlation: your sleep quality score drops by an average of 1.2 points on days where you reported 'high-intensity screen time' after 9 PM. This effect is more pronounced than late meals or exercise timing.Use case implemented
The finished system, running on its own
With the system established, John now performs a concise weekly review. He exports his sleep and activity data from Apple Health and logs it into a simple spreadsheet. A quick copy-paste into his AI tool with the refined prompt yields immediate, actionable insights. These insights allow him to make informed adjustments to his evening routine, optimising for sleep quality without guesswork. The previously overwhelming data now consistently provides clear guidance, contributing directly to his longevity efforts.
↑ 0.5 points
Weekly Sleep Quality Trend
↓ 7% variability
HRV Consistency
↓ 2 sessions/week
Evenings with Late Screen Time
What an outside observer would notice
improved by 0.8 points consistently
Sleep Quality Score
reduced by 40%
Incidence of late-night screen exposure
increased by 15%
Consistency of sleep patterns
The stack — build it yourself
Effortlessly collects sleep and activity data from wearable devices.
Provides a flexible way to combine various data streams before AI analysis.
Interprets complex datasets with simple prompts, revealing non-obvious patterns.
These are the tools used in this story. Any can be swapped for an equivalent you already trust.
Go deeper
Do this yourself
See 10-Day Challenge
This story runs on 10-Day Challenge. The tools and prompts above are the real build — swap any tool for your own equivalent and follow the same steps.