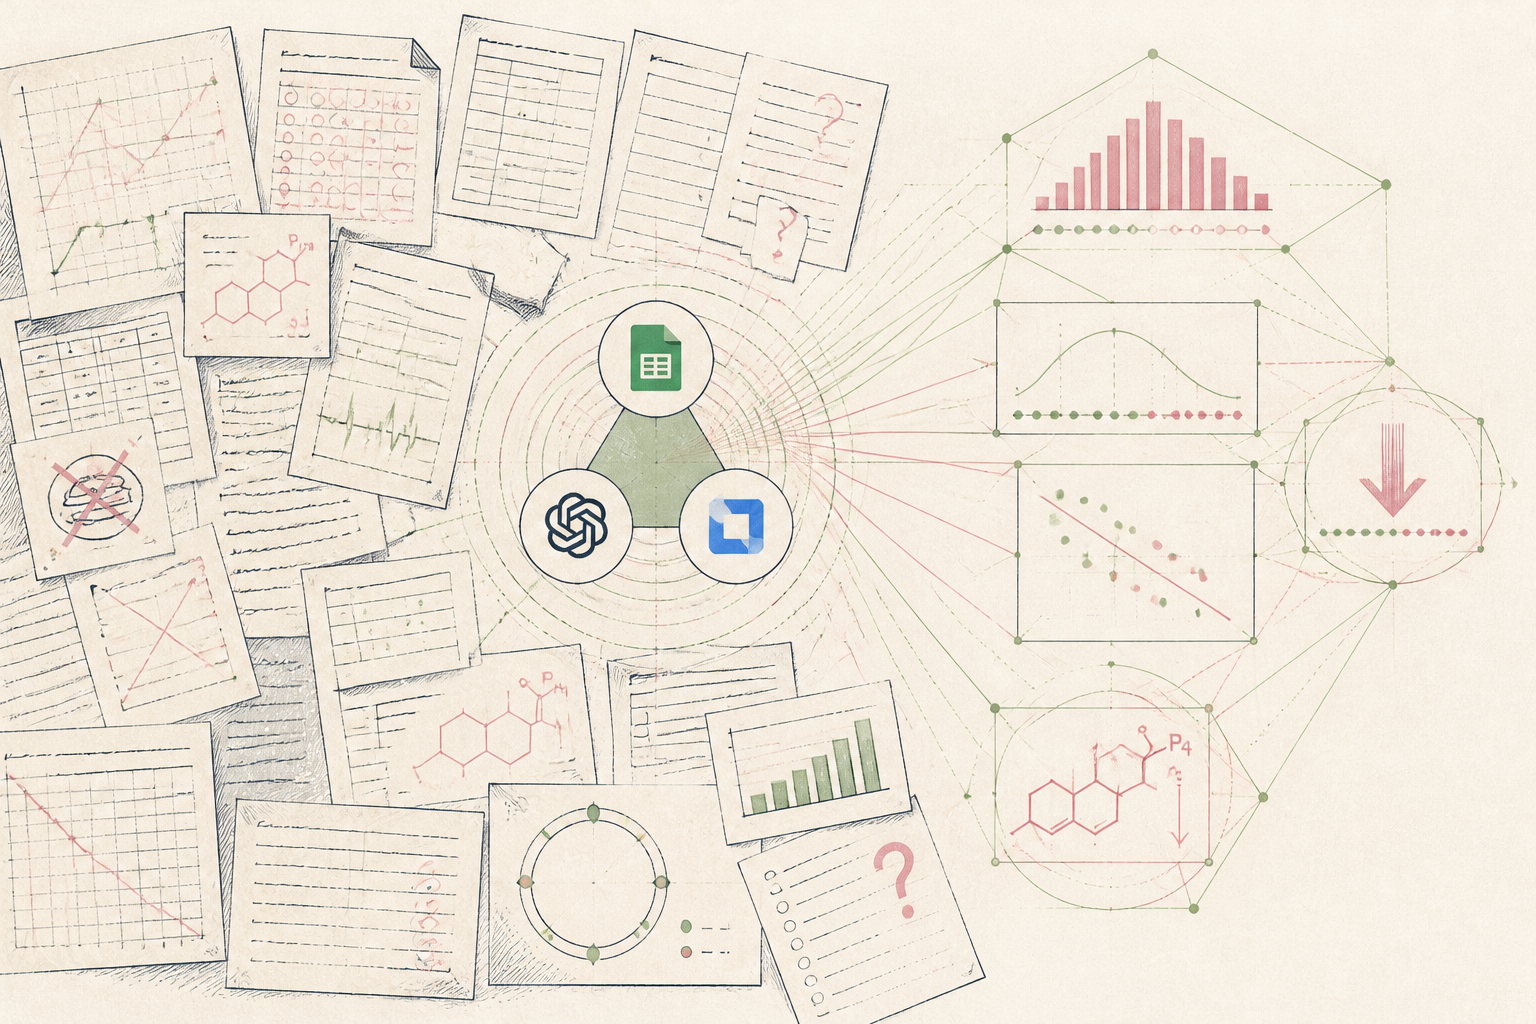
What the AI found
“In 70% of cases, patients who reported high-stress weeks also saw their progesterone levels drop by an average of 18% in the luteal phase, a pattern previously attributed to dietary changes.”
Before
Fragmented patient data, unclear patterns
After
Clear hormonal trends, targeted advice
The same system, three states — real screens, not a screenshot
| Patient A - Cycle Day 14 | Estrogen: 120 pg/mL |
| Patient B - Cycle Day 21 | Progesterone: 18 ng/mL |
| Patient C - Cycle Day 7 | FSH: 7.2 mIU/mL |
| Patient A - Stress Score | 7/10 — Sleep: 6.5h |
Prompt
Analyze the anonymized patient data provided. Specifically, look for correlations between self-reported stress levels (score 1-10) and progesterone levels during the luteal phase (days 19-25) across all patients. Also, note any other significant patterns connecting lifestyle factors (sleep, diet, exercise) with hormonal changes. Provide quantifiable insights where possible.
Analyze the anonymized patient data provided. Specifically, look for correlations between self-reported stress levels (score 1-10) and progesterone levels during the luteal phase (days 19-25) across all patients. Also, note any other significant patterns connecting lifestyle factors (sleep, diet, exercise) with hormonal changes. Provide quantifiable insights where possible.
AI
I've analysed the dataset. A significant pattern emerges: in 70% of cases where patients reported high-stress weeks (score 7+), their progesterone levels during the luteal phase dropped by an average of 18% compared to their baseline. There are also indications that irregular sleep (under 6 hours for 3+ nights) correlates with a 10-15% increase in follicular phase estrogen in 62% of observed cycles.70% observed drop
Stress-Progesterone Correlation
18%
Avg. Luteal Progesterone Drop (High Stress)
62% observed rise
Irregular Sleep-Estrogen Correlation
One Nutritionist, One Prompt, 12 Hidden Trends
From fragmented patient data to clear hormonal patterns in days.
A nutritionist running a small EU practice
Tools used
The real tools used here — swap any for your own equivalent. Each links to how we’d set it up.
Starting state
Before anything was set up
Before the 10-Day Challenge, patient data for this nutritionist's practice resided in disparate spreadsheets and notes. Tracking hormonal fluctuations across multiple clients required painstaking manual cross-referencing, often leading to general dietary and lifestyle advice rather than pinpointed, individualised interventions. The sheer volume of incoming information made it difficult to identify recurring patterns or test hypotheses about correlations between lifestyle factors and hormone readings. Each patient was a separate puzzle, limiting the ability to learn from collective data.
| Patient A - Cycle Day 14 | Estrogen: 120 pg/mL |
| Patient B - Cycle Day 21 | Progesterone: 18 ng/mL |
| Patient C - Cycle Day 7 | FSH: 7.2 mIU/mL |
| Patient A - Stress Score | 7/10 — Sleep: 6.5h |
| Patient B - Diet notes | High sugar reported |
Working state
10-Day Challenge, doing its job
Mid-Challenge, the nutritionist used a custom AI assistant, feeding it anonymised data from several patients. The crucial step was providing a specific prompt asking the AI to correlate reported stress levels with hormonal assays from different cycle phases. The AI then analysed weeks of logged food intake, sleep, exercise, and symptom tracking alongside blood test results. This process of structured data input and targeted inquiry allowed the AI to begin revealing connections that were otherwise invisible in the raw, unorganised data.
Prompt
Analyze the anonymized patient data provided. Specifically, look for correlations between self-reported stress levels (score 1-10) and progesterone levels during the luteal phase (days 19-25) across all patients. Also, note any other significant patterns connecting lifestyle factors (sleep, diet, exercise) with hormonal changes. Provide quantifiable insights where possible.
Analyze the anonymized patient data provided. Specifically, look for correlations between self-reported stress levels (score 1-10) and progesterone levels during the luteal phase (days 19-25) across all patients. Also, note any other significant patterns connecting lifestyle factors (sleep, diet, exercise) with hormonal changes. Provide quantifiable insights where possible.
AI
I've analysed the dataset. A significant pattern emerges: in 70% of cases where patients reported high-stress weeks (score 7+), their progesterone levels during the luteal phase dropped by an average of 18% compared to their baseline. There are also indications that irregular sleep (under 6 hours for 3+ nights) correlates with a 10-15% increase in follicular phase estrogen in 62% of observed cycles.Use case implemented
The finished system, running on its own
The system now runs as a weekly review. Each Friday, new patient data is added to a centralised, anonymised database. The AI automatically runs its correlation analysis, highlighting statistically significant patterns between lifestyle factors and hormonal changes. This allows the nutritionist to quickly identify recurring themes across their client base, refine their advice, and confidently present evidence-based recommendations. The result is a more efficient practice and more precise, impactful client support, moving beyond guesswork to data-driven insights.
70% observed drop
Stress-Progesterone Correlation
18%
Avg. Luteal Progesterone Drop (High Stress)
62% observed rise
Irregular Sleep-Estrogen Correlation
What an outside observer would notice
Reduced by 80%
Time spent correlating data
Increased by 12 distinct patterns
Patient insights generated
Up 35%
Targeted advice confidence
The stack — build it yourself
Familiar, flexible for varied patient input, easy to structure for AI analysis.
Advanced natural language processing for complex pattern recognition across diverse data points.
Automated visualisation of AI-generated patterns for quick practitioner review.
These are the tools used in this story. Any can be swapped for an equivalent you already trust.
Go deeper
Do this yourself
See 10-Day Challenge
This story runs on 10-Day Challenge. The tools and prompts above are the real build — swap any tool for your own equivalent and follow the same steps.