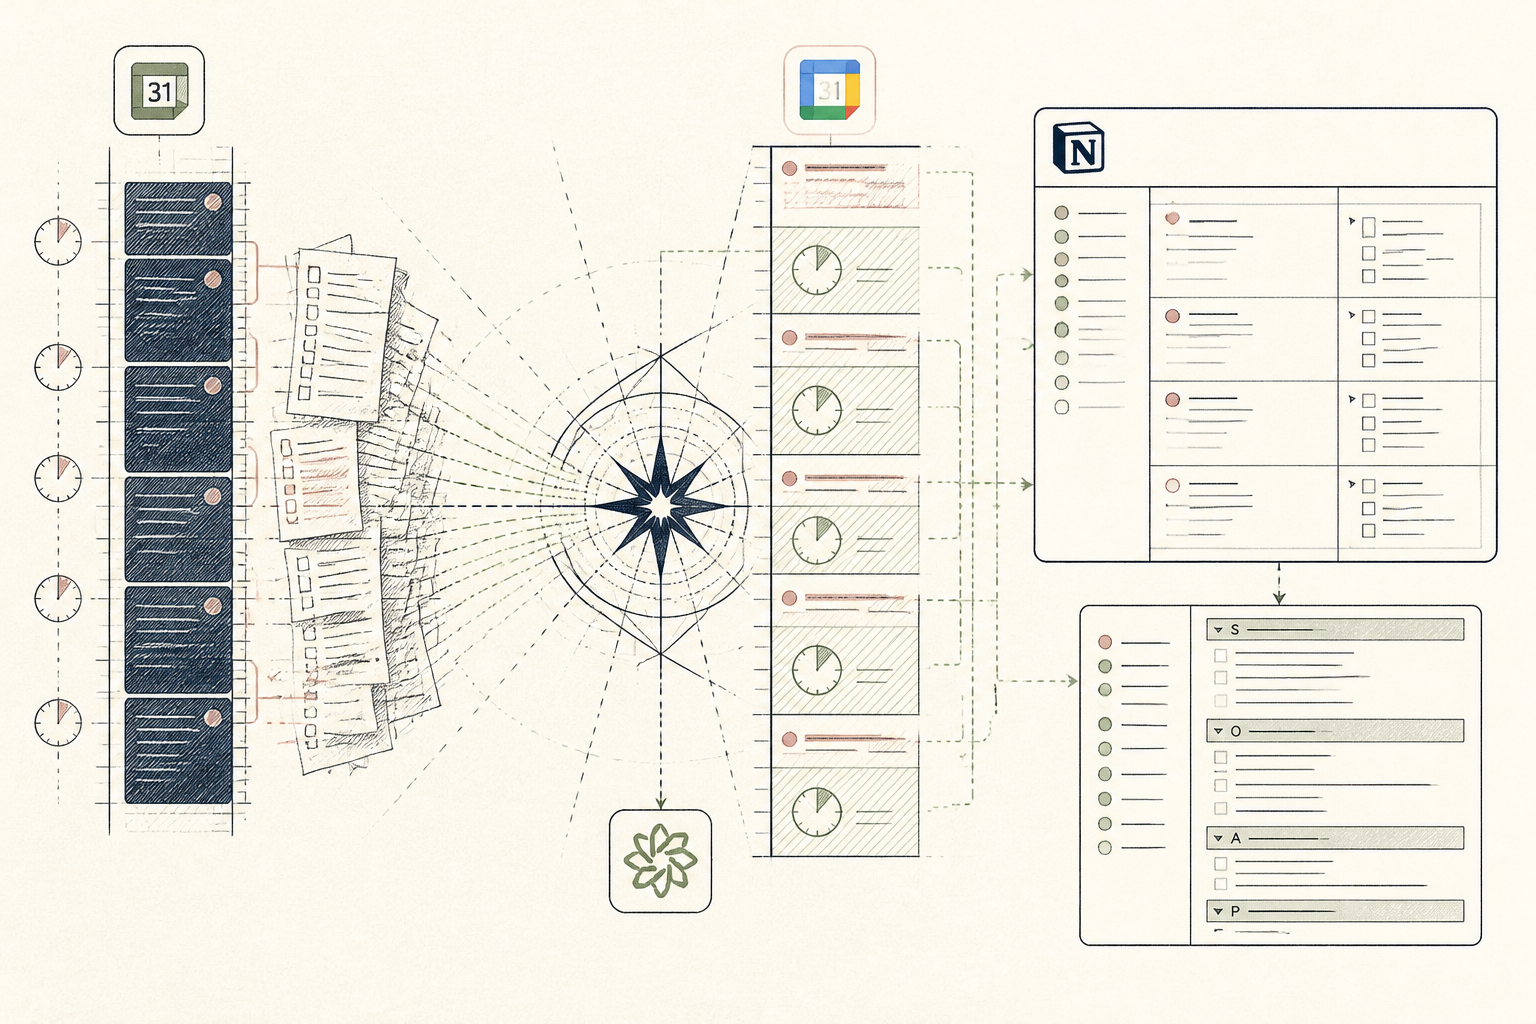
What the AI found
“Your charting debt grew exclusively on Thursdays: five 50-minute consults with zero gap averaged 22 minutes of unbilled admin spillover per slot.”
Before
6 client back-to-backs, evening charting backlog
After
calendar restructured around 2 buffer blocks
The same system, three states — real screens, not a screenshot
- Thursday backlog: 4 client notes unfinished
- Dinner pushed again to finish treatment summaries
- Headache by 3pm after 4 back-to-backs
- Weekend charting debt: approx 5 hrs
Prompt
Here are my appointment timestamps, duration lengths, and note completion times over the last six weeks. What structural pattern explains why I consistently spend 5+ hours charting every Sunday?
Here are my appointment timestamps, duration lengths, and note completion times over the last six weeks. What structural pattern explains why I consistently spend 5+ hours charting every Sunday?
AI
Your charting debt grew exclusively on Thursdays: five 50-minute consults with zero gap averaged 22 minutes of unbilled admin spillover per slot. By 4pm, your documentation delay compounds to 110 minutes, pushing note completion into your weekend.0
Uncharted charts at 6pm
-82%
Weekly admin overflow
12 min
Post-session gap
Mapping Session Density to Eliminate a Six-Hour Charting Backlog
How an independent clinical psychologist mapped appointment density to eliminate an evening administrative backlog.
A clinical psychologist in private practice, Western Europe
Tools used
The real tools used here — swap any for your own equivalent. Each links to how we’d set it up.
Starting state
Before anything was set up
Between client consults, there was never time to close a file. Five consecutive 50-minute sessions ran directly into one another, leaving zero window to document interventions before the next client sat down. By 6:00pm, six sets of shorthand reflections sat scribbled on legal pads. Evenings dissolved into administrative catch-up over dinner, carrying the unresolved emotional charge of the day long past clinic hours. Administrative friction was silently bleeding into clinical presence.
- Thursday backlog: 4 client notes unfinished
- Dinner pushed again to finish treatment summaries
- Headache by 3pm after 4 back-to-backs
- Weekend charting debt: approx 5 hrs
Working state
All-Access, doing its job
Using the All-Access implementation templates, the clinician exported six weeks of calendar booking timestamps alongside timestamps of when charting summaries were marked complete. She scrubbed all client identifying details and loaded the structured schedule into Claude. Within seconds, the model ran a cross-tabulation across day of the week, appointment density, and documentation lag. The output stripped away subjective feelings of exhaustion and laid out the structural mechanics clearly.
Prompt
Here are my appointment timestamps, duration lengths, and note completion times over the last six weeks. What structural pattern explains why I consistently spend 5+ hours charting every Sunday?
Here are my appointment timestamps, duration lengths, and note completion times over the last six weeks. What structural pattern explains why I consistently spend 5+ hours charting every Sunday?
AI
Your charting debt grew exclusively on Thursdays: five 50-minute consults with zero gap averaged 22 minutes of unbilled admin spillover per slot. By 4pm, your documentation delay compounds to 110 minutes, pushing note completion into your weekend.Use case implemented
The finished system, running on its own
The calendar now enforces a hard twelve-minute buffer after any intensive session. Notes are finalised directly within the consult window using standard prompt skeletons in Claude, while Google Calendar flags back-to-back clustering before bookings confirm. The practitioner leaves her desk at 5:15pm with every client log signed off. Weekly administrative spillover dropped from over six hours to roughly forty-five minutes. The clinical day closes cleanly, without the persistent cognitive hum of pending paperwork hanging over dinner.
0
Uncharted charts at 6pm
-82%
Weekly admin overflow
12 min
Post-session gap
What an outside observer would notice
6.5 hr → 0.8 hr/wk
Evening charting hours
0 min → 12 min
Between-session buffer
The stack — build it yourself
Exports pristine timestamp intervals for appointment density and buffer gaps.
Handles complex, multi-week text schedules without logging or sharing private client context.
Provides lightweight structured fields for immediate charting during buffer blocks.
These are the tools used in this story. Any can be swapped for an equivalent you already trust.
Go deeper
Do this yourself
Explore All-Access workflows
This story runs on All-Access. The tools and prompts above are the real build — swap any tool for your own equivalent and follow the same steps.