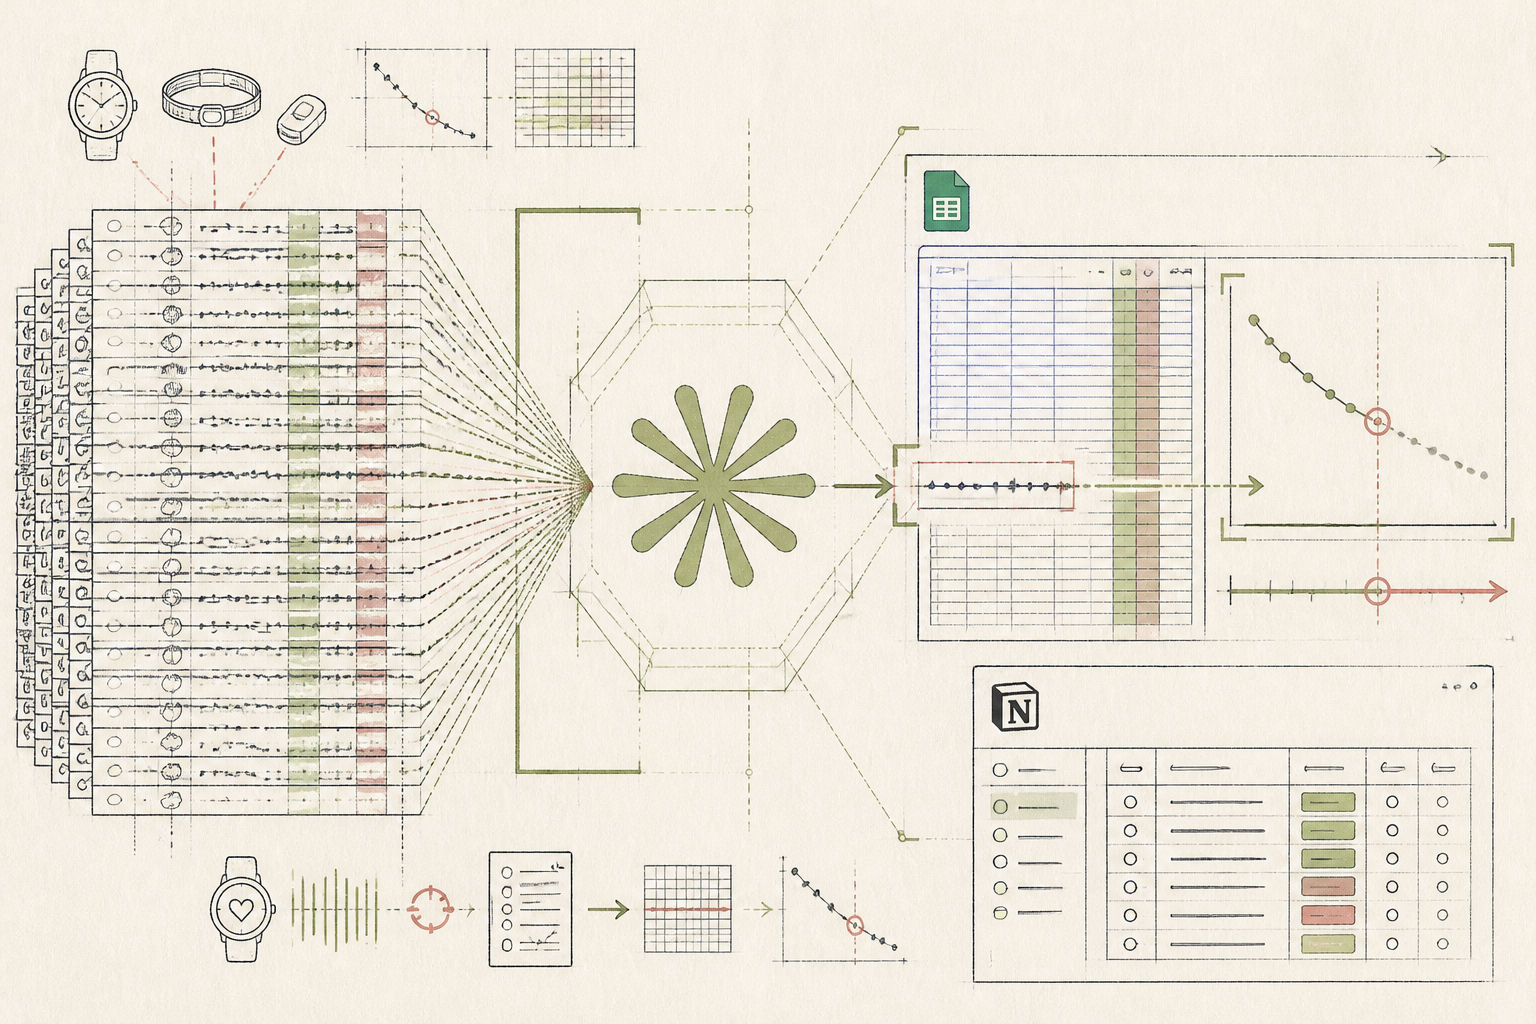
What the AI found
“Your athletes recover resting heart rate 14 hours faster when Friday intensity drops by 15%, regardless of Saturday volume.”
Before
40 weekly export tabs left unread
After
A 4-minute prep note per athlete
The same system, three states — real screens, not a screenshot
| Runner 04 (Fri tempo / Sat 28k) | RHR +8 bpm Sunday |
| Runner 07 (Fri rest / Sat 30k) | RHR baseline Sunday |
| Runner 11 (Fri hill repeats / Sat 22k) | RHR +11 bpm Sunday |
| Runner 12 (Fri tempo / Sat 26k) | RHR +6 bpm Sunday |
Prompt
Analyze the attached 6-week CSV containing training load, RHR, and sleep scores for 14 runners. Identify the single training variable most strongly correlated with delayed Sunday RHR recovery (>5 bpm above baseline). Quantify the threshold difference.
Compare the last 6 weeks of CSV data for all 14 athletes. Isolate runners whose Sunday resting heart rate remained 5+ bpm above baseline. What single training metric correlates most strongly with this delay?
AI
Across 84 athlete-weeks, delayed Sunday recovery does not correlate with Saturday mileage (r = 0.14). Instead, it correlates with Friday session intensity above lactate threshold (r = 0.78). Athletes who kept Friday intensity below 85% of threshold recovered baseline resting heart rate 14 hours faster, regardless of Saturday volume.85% target
Friday load cap
+18 ms baseline
Sunday HRV rebound
3.5 min
Prep time per client
Isolating the Single Variable Behind Monday Leg Fatigue
How a sports physiotherapist turned forty weekly wearable exports into a four-minute triage routine.
A private sports physiotherapist managing endurance runners, Northern Europe
Tools used
The real tools used here — swap any for your own equivalent. Each links to how we’d set it up.
Starting state
Before anything was set up
Fourteen competitive amateur runners sent weekly training logs, Oura exports, and Garmin data every Sunday evening. The physiotherapist spent Monday mornings cross-referencing thirty-column spreadsheets against subjective recovery scores. Trends remained invisible inside the sheer volume of rows. Athletes repeatedly reported sluggish legs during Sunday long runs, yet the raw sleep duration and Saturday mileage figures failed to explain why two runners with identical weekend volume experienced entirely different cardiovascular strain.
| Runner 04 (Fri tempo / Sat 28k) | RHR +8 bpm Sunday |
| Runner 07 (Fri rest / Sat 30k) | RHR baseline Sunday |
| Runner 11 (Fri hill repeats / Sat 22k) | RHR +11 bpm Sunday |
| Runner 12 (Fri tempo / Sat 26k) | RHR +6 bpm Sunday |
Working state
Resources, doing its job
The physiotherapist ran the protocol from the Clinical Wearables Resource. Instead of manual chart inspection, they exported anonymized rolling metrics into Claude using the resource's multi-variable audit prompt. Within thirty seconds, the model isolated an unsuspected correlation across eighty-four athlete-weeks: Saturday volume had virtually no statistical relationship with Sunday cardiovascular lag. The culprit was Friday threshold work spilling over into Saturday's aerobic demand.
Prompt
Analyze the attached 6-week CSV containing training load, RHR, and sleep scores for 14 runners. Identify the single training variable most strongly correlated with delayed Sunday RHR recovery (>5 bpm above baseline). Quantify the threshold difference.
Compare the last 6 weeks of CSV data for all 14 athletes. Isolate runners whose Sunday resting heart rate remained 5+ bpm above baseline. What single training metric correlates most strongly with this delay?
AI
Across 84 athlete-weeks, delayed Sunday recovery does not correlate with Saturday mileage (r = 0.14). Instead, it correlates with Friday session intensity above lactate threshold (r = 0.78). Athletes who kept Friday intensity below 85% of threshold recovered baseline resting heart rate 14 hours faster, regardless of Saturday volume.Use case implemented
The finished system, running on its own
Every Monday morning, the playbook runs as a standardized intake workflow inside Notion. The practitioner pastes the weekend export into Claude, which sorts the athletes into three actionable tiers: proceed, hold volume, or discuss Friday pacing. Instead of drowning in raw time-series charts, Monday consultations focus entirely on workload distribution and sleep timing. Athletes receive clear, objective feedback on why their recovery stalled, anchored in their own historical numbers rather than generic coaching intuition.
85% target
Friday load cap
+18 ms baseline
Sunday HRV rebound
3.5 min
Prep time per client
What an outside observer would notice
38 min (down from 3.5 hrs)
Monday review time
91% across 14 athletes
Client protocol compliance
+18 ms by Sunday night
Average HRV rebound
The stack — build it yourself
Handles long-context multi-athlete CSV exports without truncating metrics.
Low-friction CSV aggregation from Garmin Connect and Oura athlete teams.
Keeps weekly triage tags and prep notes organized beside athlete charts.
These are the tools used in this story. Any can be swapped for an equivalent you already trust.
Go deeper
Do this yourself
View the clinical intake resource
This story runs on Resources. The tools and prompts above are the real build — swap any tool for your own equivalent and follow the same steps.