What the AI found
“Your client’s delayed recovery scores correlated with evening hydration timing, not total sleep duration or session volume.”
Before
3 client spreadsheets, unread Oura exports, guesswork
After
One 8-minute Friday audit of recovery data
The same system, three states — real screens, not a screenshot
| Mon 12/02 | RHR 58, HRV 42, sleep 7.8h, hard intervals |
| Tue 13/02 | RHR 62, HRV 36, sleep 8.1h, heavy legs |
| Wed 14/02 | RHR 64, HRV 34, sleep 7.5h, rest day |
| Thu 15/02 | RHR 61, HRV 38, sleep 8.4h, easy run |
Prompt
Review this 4-week ledger for runner recovery dips. Compare sleep stages against daily behavioral notes. What single variable clusters with elevated nocturnal resting heart rate?
Review this 4-week ledger for runner recovery dips. Compare sleep stages against daily behavioral notes. What single variable clusters with elevated nocturnal resting heart rate?
AI
Resting heart rate elevates by an average of 5.8 bpm on nights when dinner or fluid intake occurred within 75 minutes of sleep. Total sleep duration and interval volume show zero statistical correlation with next-day recovery scores in this period.8 mins
Weekly audit time
94%
Protocol compliance
1 per cycle
Intervention variables
How One Practitioner Stopped Guessing Client Recovery Bottlenecks
How an independent sports physiotherapist used Claude to isolate an invisible recovery bottleneck.
A private sports physiotherapist in independent practice, EU
Tools used
The real tools used here — swap any for your own equivalent. Each links to how we’d set it up.
Starting state
Before anything was set up
Every Friday afternoon meant reconciling two separate spreadsheets against CSV exports from an Oura ring for a marathon runner whose resting heart rate was drifting upward. The client complained of persistent morning sluggishness despite hitting eight hours in bed. Screen time was already limited; nutrition was tightly monitored. The notes were full of vague guesses: perhaps overreaching, perhaps mild travel fatigue, perhaps poor sleep hygiene. Nothing lined up cleanly.
| Mon 12/02 | RHR 58, HRV 42, sleep 7.8h, hard intervals |
| Tue 13/02 | RHR 62, HRV 36, sleep 8.1h, heavy legs |
| Wed 14/02 | RHR 64, HRV 34, sleep 7.5h, rest day |
| Thu 15/02 | RHR 61, HRV 38, sleep 8.4h, easy run |
Working state
Core Course, doing its job
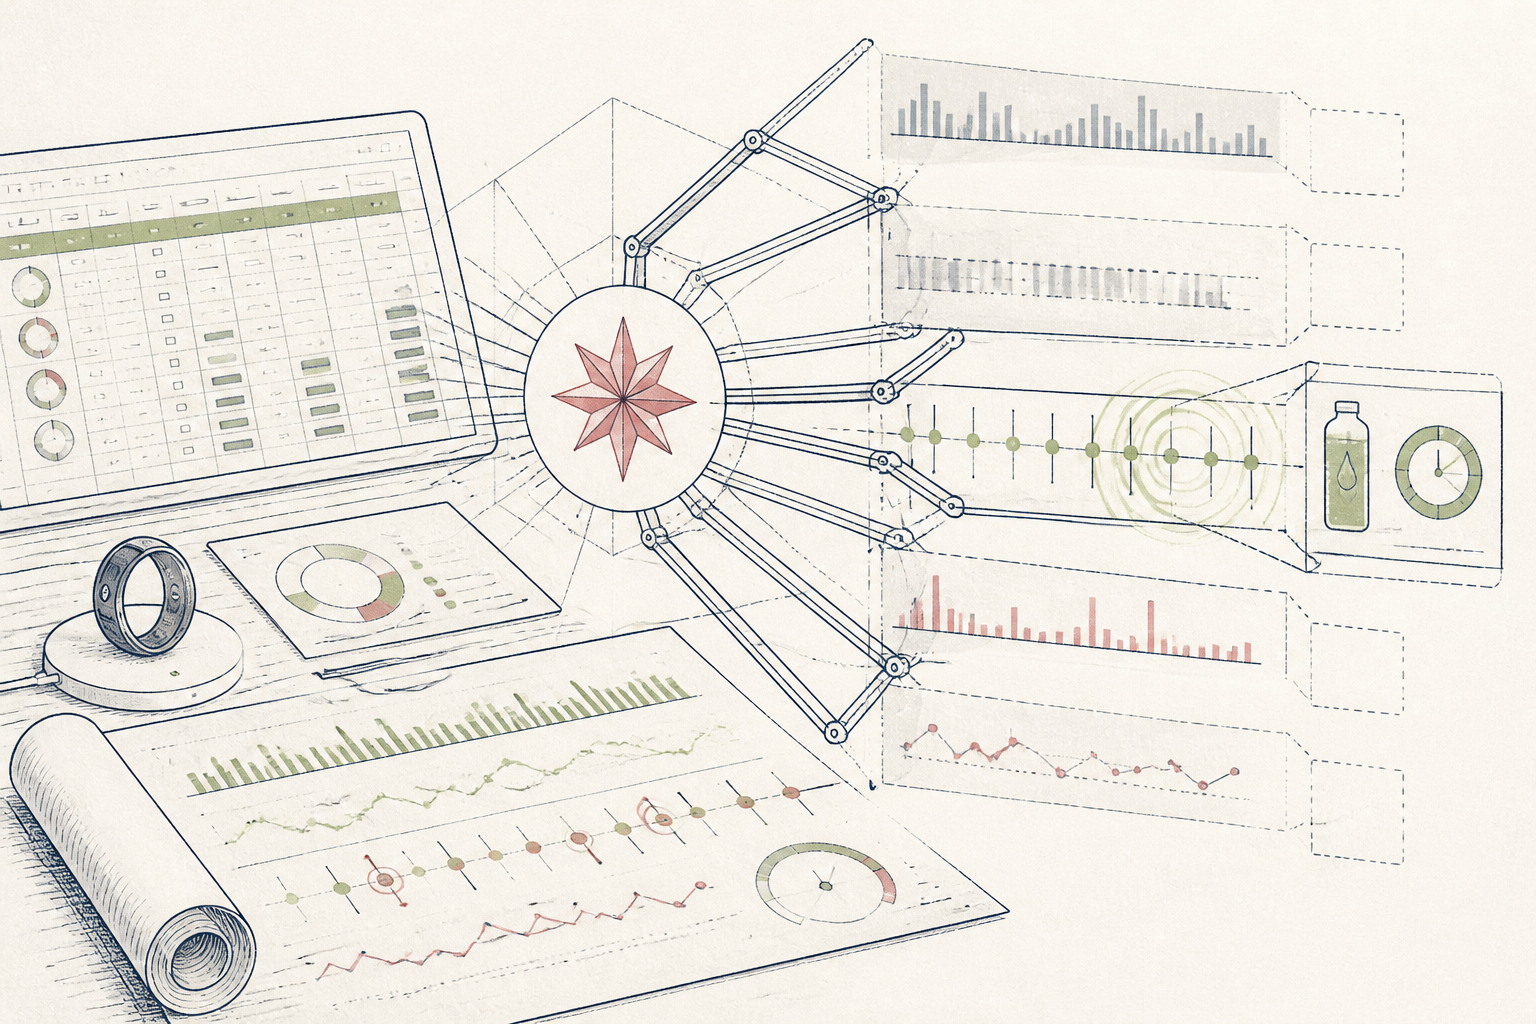
Applying the Core Course framework, the practitioner stripped away secondary metrics. The data was arranged into a standardized ledger: biometrics alongside a minimal behavioral log. During their weekly audit, the practitioner pasted the ledger into Claude with a prompt designed to isolate correlations rather than general advice. In seconds, the model highlighted a pattern hidden across weeks of entries: the lowest scores consistently followed late hydration, independent of physical training strain.
Prompt
Review this 4-week ledger for runner recovery dips. Compare sleep stages against daily behavioral notes. What single variable clusters with elevated nocturnal resting heart rate?
Review this 4-week ledger for runner recovery dips. Compare sleep stages against daily behavioral notes. What single variable clusters with elevated nocturnal resting heart rate?
AI
Resting heart rate elevates by an average of 5.8 bpm on nights when dinner or fluid intake occurred within 75 minutes of sleep. Total sleep duration and interval volume show zero statistical correlation with next-day recovery scores in this period.Use case implemented
The finished system, running on its own
The practice now runs on a single, self-sustaining loop. Every Friday afternoon, raw biometric exports flow into a structured Google Sheets template without manual tidying. Claude processes the rows against the weekly protocol prompt, identifying any signal that warrants adjustment for Monday. Client check-ins shifted from open-ended troubleshooting sessions to a brisk, evidence-led review of one isolated factor. The practitioner spends minimal time processing rows of numbers, while the client receives clear, unhurried guidance grounded entirely in their own recorded baseline.
8 mins
Weekly audit time
94%
Protocol compliance
1 per cycle
Intervention variables
What an outside observer would notice
8 mins per client
Case review duration
1 per 14-day cycle
Active experiment variables
The stack — build it yourself
Zero-friction daily biometrics logging without platform lock-in.
Superior reasoning over unstructured notes and longitudinal tabular data.
Consistent export format for resting heart rate and sleep staging.
These are the tools used in this story. Any can be swapped for an equivalent you already trust.
Go deeper
Do this yourself
Explore the Core Course
This story runs on Core Course. The tools and prompts above are the real build — swap any tool for your own equivalent and follow the same steps.