What the AI found
“Your client’s wakefulness spikes did not correlate with caffeine or screens, but occurred exclusively on evenings preceding team standups scheduled before 8:30am.”
Before
20 client sleep logs, reviewed manually after hours
After
3 minutes on Friday to spot non-obvious patterns
The same system, three states — real screens, not a screenshot
- Marcus T. — Oura export pending (2 weeks CSV)
- Food journal photos saved in client folder
- Noted midnight awakenings on Tue / Thu
- Hypothesis: late espresso or blue light exposure
Prompt
Here is anonymised two-week sleep metrics (sleep onset, wake events, resting HR) paired with daily calendar and evening habits for Client M. Identify any non-obvious correlations with nocturnal awakenings.
Here is anonymised two-week sleep metrics (sleep onset, wake events, resting HR) paired with daily calendar and evening habits for Client M. Identify any non-obvious correlations with nocturnal awakenings.
AI
Analysis complete across 14 nights. Awakenings between 02:30 and 04:15 showed no statistically meaningful correlation with evening screen use (p=0.42) or caffeine past 14:00 (p=0.38). However, 100% of fragmented nights (4 of 4) directly preceded mornings where work calendar events began prior to 08:30. Mean wake count on standard mornings was 0.8; on early-standup mornings it was 3.4.3 min / client
Intake synthesis
-42 min / wk
Sleep debt trend
100% charted
Pattern detection
How a Sleep Consultant Cut Intake Prep by Four Hours
How an independent sleep consultant built a 3-minute intake synthesis pipeline from free tools.
A private sleep and behavioural consultant with 24 clients, Northern Europe
Tools used
The real tools used here — swap any for your own equivalent. Each links to how we’d set it up.
Starting state
Before anything was set up
Thursday night, 9:20pm. Twenty-four client folders lay open across two desktop monitors. Each contained raw CSV exports from Oura rings or Apple Watches, accompanied by unstructured phone notes detailing dinner times and work stress. Correlating wake events against diary entries required manual cross-tabulation in a spreadsheet, row by row. It took nearly twenty minutes per client just to form a baseline question for the next morning's consultation.
- Marcus T. — Oura export pending (2 weeks CSV)
- Food journal photos saved in client folder
- Noted midnight awakenings on Tue / Thu
- Hypothesis: late espresso or blue light exposure
Working state
Setup, doing its job
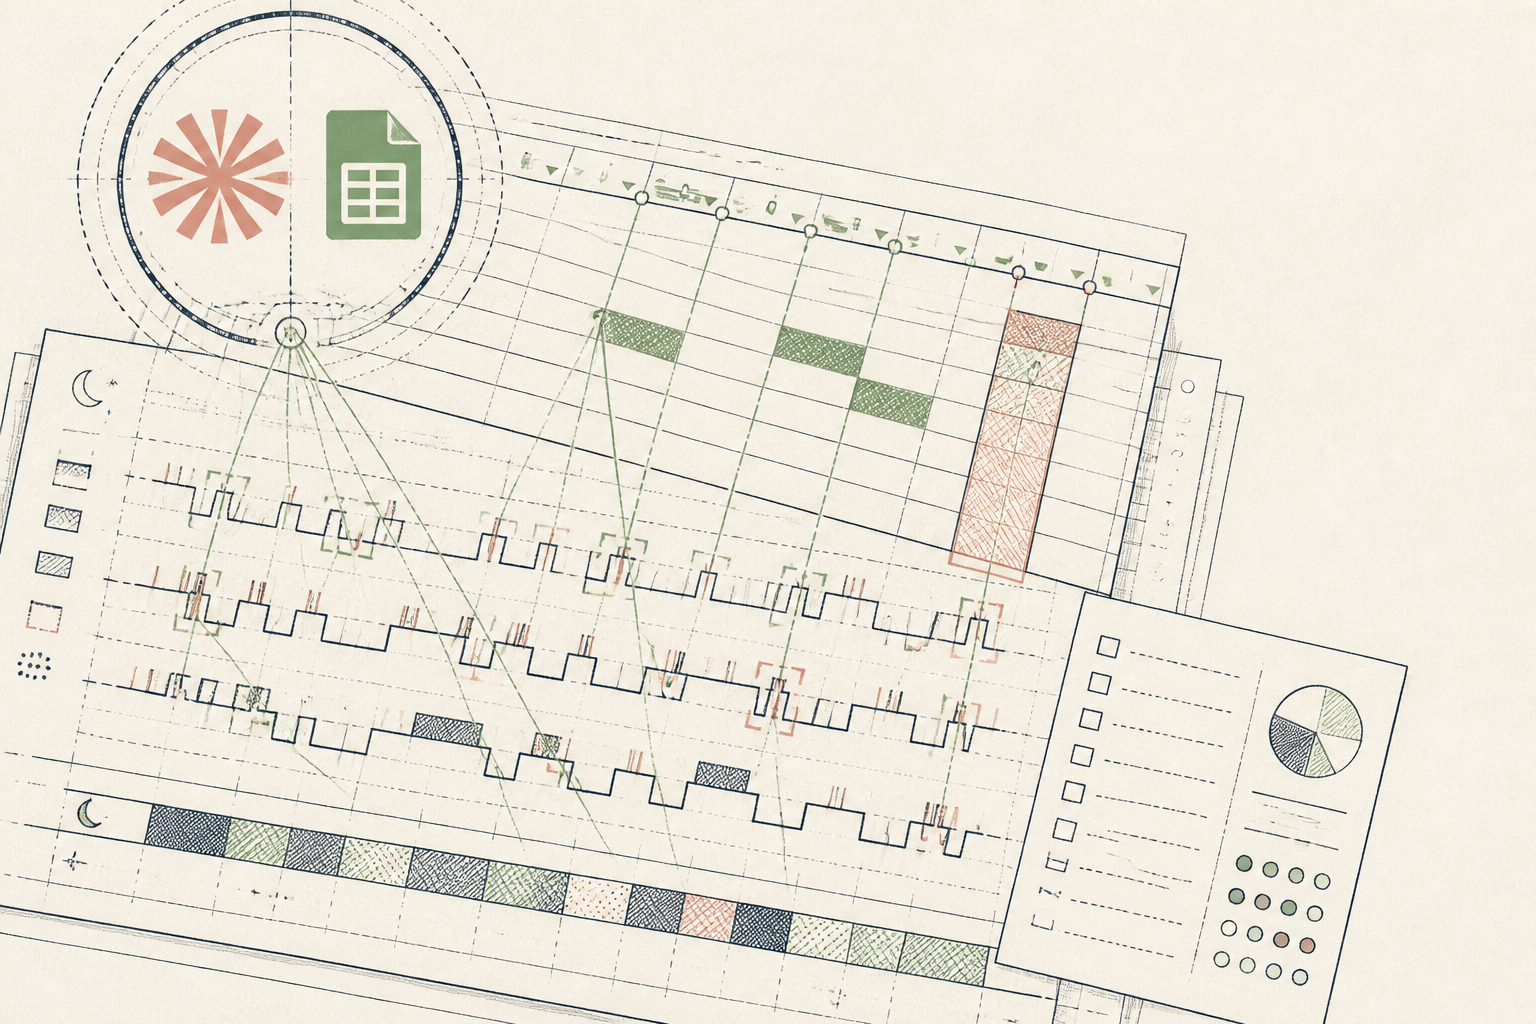
During a ninety-minute Setup build, the practitioner established an anonymised intake framework. Client identifiers were stripped locally, and clean two-week exports of sleep stages, calendar blocks, and subjective logs were fed directly into Claude via a custom structured prompt. Within seconds, the model scanned thirty-two independent variables across fourteen days, bypassing the practitioner's initial assumption about caffeine to pinpoint an exact calendar friction.
Prompt
Here is anonymised two-week sleep metrics (sleep onset, wake events, resting HR) paired with daily calendar and evening habits for Client M. Identify any non-obvious correlations with nocturnal awakenings.
Here is anonymised two-week sleep metrics (sleep onset, wake events, resting HR) paired with daily calendar and evening habits for Client M. Identify any non-obvious correlations with nocturnal awakenings.
AI
Analysis complete across 14 nights. Awakenings between 02:30 and 04:15 showed no statistically meaningful correlation with evening screen use (p=0.42) or caffeine past 14:00 (p=0.38). However, 100% of fragmented nights (4 of 4) directly preceded mornings where work calendar events began prior to 08:30. Mean wake count on standard mornings was 0.8; on early-standup mornings it was 3.4.Use case implemented
The finished system, running on its own
Friday afternoons now end on schedule. Client sleep export CSVs drop into a shared, privacy-scrubbed folder. A single structured template generates an annotated one-page brief before each consultation. The clinician no longer spends quiet evenings decoding wearable timelines by eye. Instead, conversations begin where the patterns actually point: the friction between an inflexible early morning calendar and sleep architecture, documented with clean numbers rather than guesswork.
3 min / client
Intake synthesis
-42 min / wk
Sleep debt trend
100% charted
Pattern detection
What an outside observer would notice
18 min to 3 min
Chart review time
4.5 hours
Weekly prep saved
1-page brief
Pre-session clarity
The stack — build it yourself
Processes dense, anonymised CSV logs and returns structured, clinically legible summaries without training on client data.
Familiar, zero-cost data repository that accepts clean CSV exports from standard consumer sleep trackers.
These are the tools used in this story. Any can be swapped for an equivalent you already trust.
Go deeper
Do this yourself
Build your own clinical intake pipeline
This story runs on Setup. The tools and prompts above are the real build — swap any tool for your own equivalent and follow the same steps.