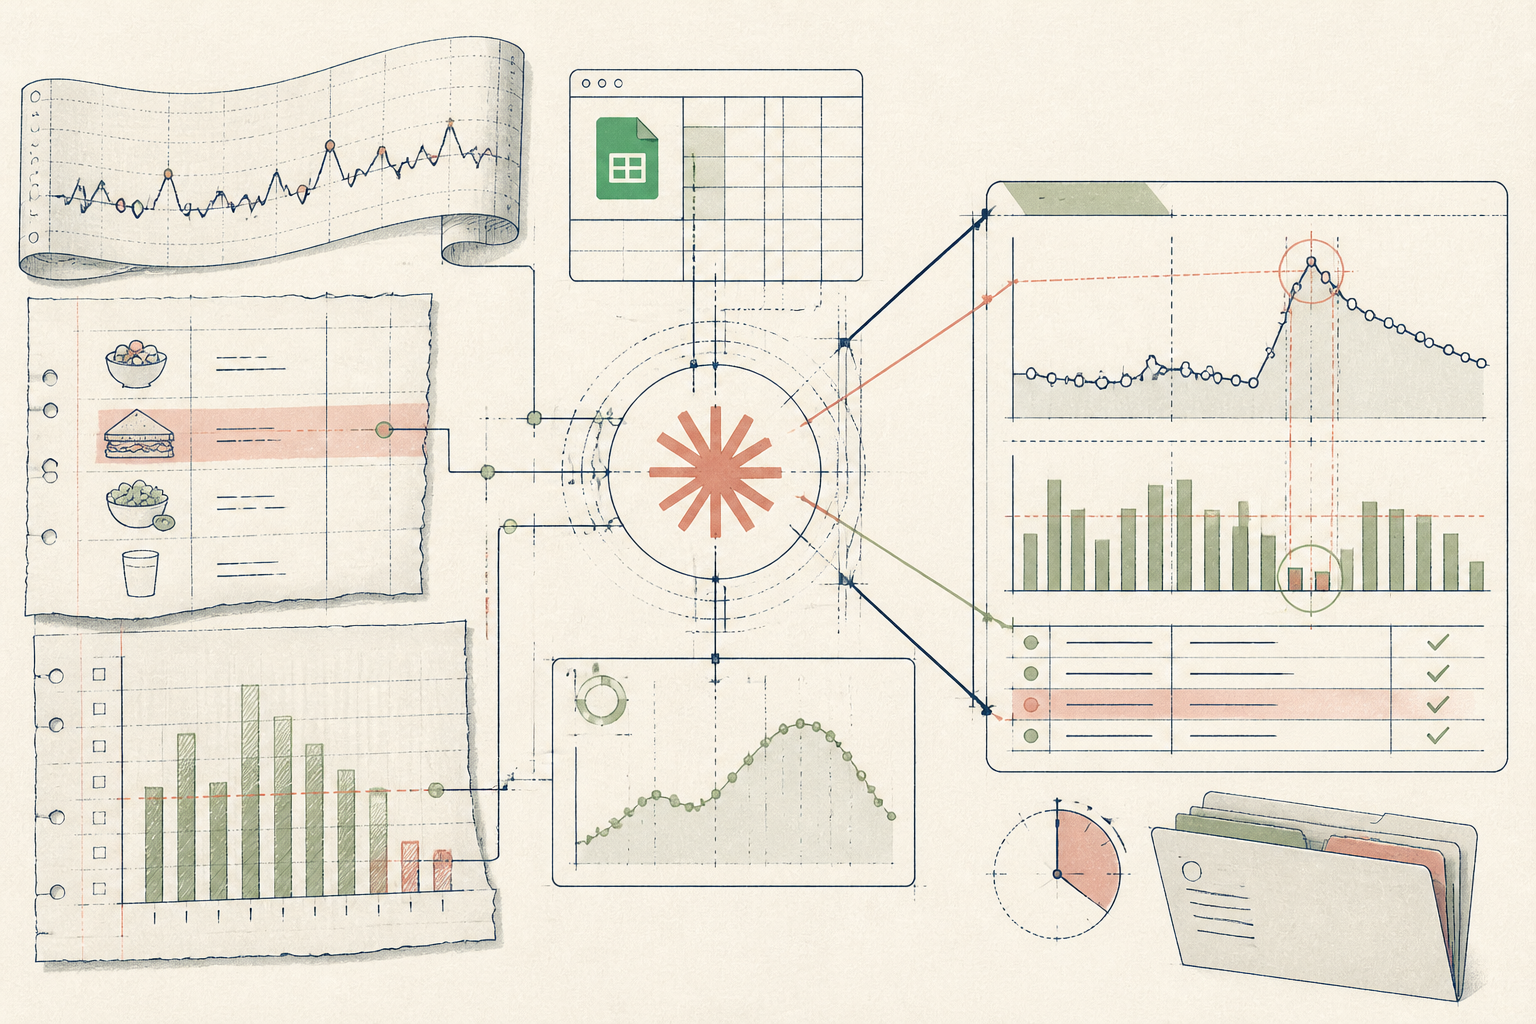
What the AI found
“Your client's post-lunch glucose excursions of +3.4 mmol/L occurred only on days with morning commute walks under 1,200 steps, irrespective of reported carbohydrate intake.”
Before
40 minutes assembling split CSVs across three portals
After
one 12-minute review before each patient consult
The same system, three states — real screens, not a screenshot
- Client M: 14-day CGM export in Downloads (CSV)
- Photos of handwritten lunch logs sent via WhatsApp
- Need to check why Tuesdays always spike around 14:00
- Still spending 45m reformatting before each Zoom call
Prompt
Attached is anonymised 14-day data: Column A is timestamp, B is glucose (mmol/L), C is step count per hour, D is logged meal text. Identify any recurring excursions (>7.8 mmol/L) within 2 hours post-prandial and highlight correlations with movement or meal composition.
Attached is anonymised 14-day data: Column A is timestamp, B is glucose (mmol/L), C is step count per hour, D is logged meal text. Identify any recurring excursions (>7.8 mmol/L) within 2 hours post-prandial and highlight correlations with movement or meal composition.
AI
Across 14 days, 6 post-prandial excursions exceeded 7.8 mmol/L (mean peak: 8.9 mmol/L). All 6 occurred between 13:30 and 14:45. Crucially, meal composition varied widely (two high-fibre salads, four carbohydrate-dense meals), but all 6 events occurred on days where morning steps prior to 12:00 were below 1,200. On days with >3,500 morning steps, the identical meal produced a mean excursion of only +1.2 mmol/L.11 mins
Prep time per review
3 streams
Data sources unified
100% on time
Weekly review cadence
How a Metabolic Practitioner Automated Clinical Preparation with Claude
How a solo nutrition practitioner unified fragmented glucose logs and food notes into a 12-minute review workflow using free tools.
A private metabolic health practitioner running a solo nutrition clinic, Northern Europe
Tools used
The real tools used here — swap any for your own equivalent. Each links to how we’d set it up.
Starting state
Before anything was set up
Her Friday afternoon was lost to administrative triage. On her desk sat an exported Dexcom CSV with 1,340 rows of ambient glucose values, a separate spreadsheet of step counts from an Apple Watch, and a WhatsApp folder containing twenty photograph attachments of a client's handwritten meal logs. Matching an afternoon glycemic spike to what the client actually ate required three open browser tabs, manual row alignment, and twenty minutes of cross-referencing before she could even begin thinking about clinical guidance.
- Client M: 14-day CGM export in Downloads (CSV)
- Photos of handwritten lunch logs sent via WhatsApp
- Need to check why Tuesdays always spike around 14:00
- Still spending 45m reformatting before each Zoom call
Working state
Setup, doing its job
During a ninety-minute Setup build, she created a repeatable template in Google Sheets that harmonises timestamps from CGM downloads and basic food journals. She stripped all personal identifiers and pasted the consolidated tabular block into Claude with an operational analysis prompt. Within twenty seconds, the model scanned two weeks of discontinuous entries and surfaced an inverse relationship between morning ambulation and post-prandial stability that had remained invisible across separate app screens.
Prompt
Attached is anonymised 14-day data: Column A is timestamp, B is glucose (mmol/L), C is step count per hour, D is logged meal text. Identify any recurring excursions (>7.8 mmol/L) within 2 hours post-prandial and highlight correlations with movement or meal composition.
Attached is anonymised 14-day data: Column A is timestamp, B is glucose (mmol/L), C is step count per hour, D is logged meal text. Identify any recurring excursions (>7.8 mmol/L) within 2 hours post-prandial and highlight correlations with movement or meal composition.
AI
Across 14 days, 6 post-prandial excursions exceeded 7.8 mmol/L (mean peak: 8.9 mmol/L). All 6 occurred between 13:30 and 14:45. Crucially, meal composition varied widely (two high-fibre salads, four carbohydrate-dense meals), but all 6 events occurred on days where morning steps prior to 12:00 were below 1,200. On days with >3,500 morning steps, the identical meal produced a mean excursion of only +1.2 mmol/L.Use case implemented
The finished system, running on its own
Every Friday at 4pm, a single Google Sheets macro combines exported sensor logs and food notes into a clean anonymised ledger. She opens Claude, pastes the automated script, and receives a two-paragraph digest of divergent patterns across her seven active metabolic clients. Prep time per consultation dropped from forty minutes of cross-referencing split spreadsheets to twelve minutes of focused clinical synthesis, leaving her headspace entirely clear for the client in front of her.
11 mins
Prep time per review
3 streams
Data sources unified
100% on time
Weekly review cadence
What an outside observer would notice
40m down to 12m
Consult prep time
14 days into 1 view
Unstructured logs unified
-68%
Weekly admin overhead
The stack — build it yourself
Strong context window for parsing dense multi-week tabular logs without truncating meal notes.
Zero-cost, scriptable ledger that standardises disparate CSV exports before analysis.
Standard clinical export for ambient sensor readings across 14-day wear cycles.
These are the tools used in this story. Any can be swapped for an equivalent you already trust.
Go deeper
Do this yourself
Build your clinical review system
This story runs on Setup. The tools and prompts above are the real build — swap any tool for your own equivalent and follow the same steps.