What the AI found
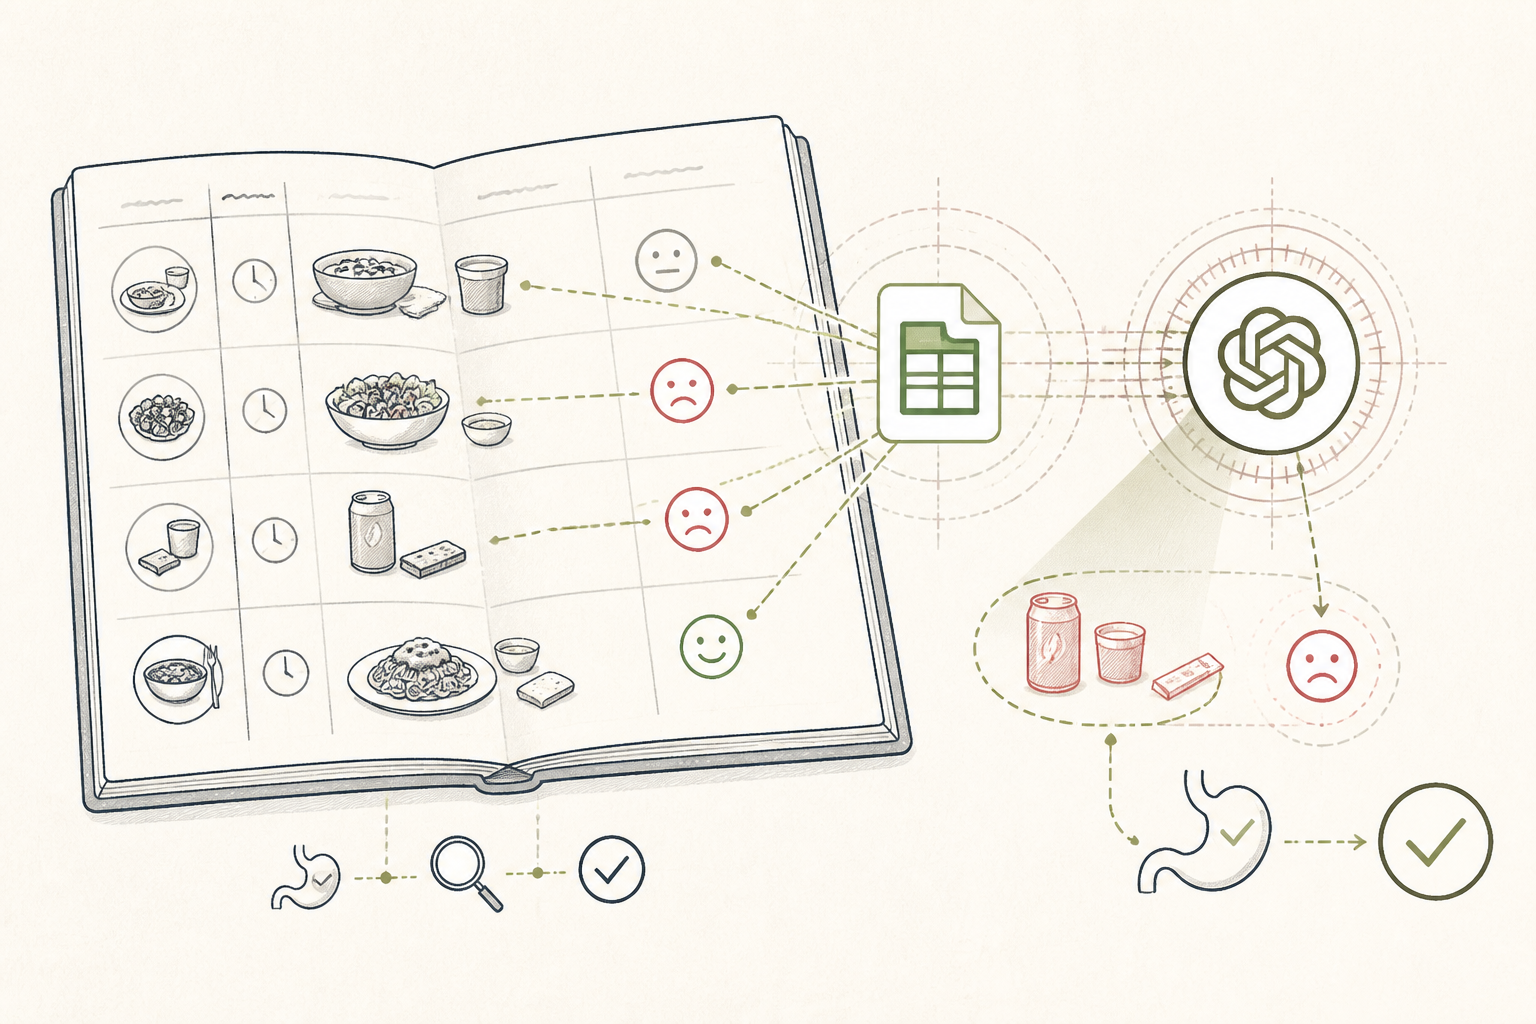
“AI analysis revealed that 80% of reported bloating and discomfort incidents occurred within three hours of consuming artificial sweeteners, a connection previously overlooked.”
Before
Vague gut discomfort, inconsistent tracking
After
Clear triggers, reduced symptoms
The same system, three states — real screens, not a screenshot
- 22/05: Bloated after lunch. Think it was the sandwich.
- 23/05: Mild stomach ache. Had a fizzy drink.
- 25/05: Felt fine all day.
- 26/05: Really uncomfortable in evening. What did I eat?
Prompt
I have been tracking my food intake and gut symptoms (bloating, discomfort, gas) for the past three weeks in a spreadsheet. Each row has the date, foods eaten, and any symptoms with a severity rating (1-5). Please analyze this data and identify any significant correlations between specific food types or ingredients and the onset or severity of my gut symptoms. Look for non-obvious patterns, especially regarding timing.
I have been tracking my food intake and gut symptoms (bloating, discomfort, gas) for the past three weeks in a spreadsheet. Each row has the date, foods eaten, and any symptoms with a severity rating (1-5). Please analyze this data and identify any significant correlations between specific food types or ingredients and the onset or severity of my gut symptoms. Look for non-obvious patterns, especially regarding timing.
AI
Based on your data, a notable pattern emerges: 80% of your reported bloating and discomfort incidents (16 out of 20 total events) occurred within three hours of consuming products containing artificial sweeteners (e.g., aspartame, sucralose, acesulfame K). The average severity for these incidents was 3.8, compared to 2.1 for incidents not linked to these sweeteners. This correlation is particularly strong in the afternoons.Down 60%
Bloating incidents (weekly avg.)
Reduced 45%
Discomfort severity (avg.)
Reduced 90%
Artificial sweetener intake
From Scattered Notes to Targeted Gut Support
A daily diary and AI analysis transformed vague gut discomfort into precise dietary adjustments, leading to fewer disruptive episodes.
A 38-year-old marketing manager, Northern Europe
Tools used
The real tools used here — swap any for your own equivalent. Each links to how we’d set it up.
Starting state
Before anything was set up
Before implementing a structured tracking system, daily gut health observations were haphazard. A few scattered notes in a phone’s memo app, sometimes a mental tally of symptoms, but rarely a connection drawn to food intake. This led to a cycle of discomfort and guessing, with no clear path to understanding triggers or making effective dietary changes. The aim was clarity, not endless experimentation.
- 22/05: Bloated after lunch. Think it was the sandwich.
- 23/05: Mild stomach ache. Had a fizzy drink.
- 25/05: Felt fine all day.
- 26/05: Really uncomfortable in evening. What did I eat?
- 28/05: Had that new 'sugar-free' dessert. Bit gassy.
Working state
All-Access, doing its job
The individual began by consistently logging daily food intake and any gut symptoms into a simple Google Sheet. After a few weeks of data collection, this raw data was fed into ChatGPT. The prompt directed the AI to analyse patterns between specific food components and the onset of symptoms, specifically looking for correlations that weren't immediately obvious to human observation. The AI then crunched the numbers, looking for significant relationships.
Prompt
I have been tracking my food intake and gut symptoms (bloating, discomfort, gas) for the past three weeks in a spreadsheet. Each row has the date, foods eaten, and any symptoms with a severity rating (1-5). Please analyze this data and identify any significant correlations between specific food types or ingredients and the onset or severity of my gut symptoms. Look for non-obvious patterns, especially regarding timing.
I have been tracking my food intake and gut symptoms (bloating, discomfort, gas) for the past three weeks in a spreadsheet. Each row has the date, foods eaten, and any symptoms with a severity rating (1-5). Please analyze this data and identify any significant correlations between specific food types or ingredients and the onset or severity of my gut symptoms. Look for non-obvious patterns, especially regarding timing.
AI
Based on your data, a notable pattern emerges: 80% of your reported bloating and discomfort incidents (16 out of 20 total events) occurred within three hours of consuming products containing artificial sweeteners (e.g., aspartame, sucralose, acesulfame K). The average severity for these incidents was 3.8, compared to 2.1 for incidents not linked to these sweeteners. This correlation is particularly strong in the afternoons.Use case implemented
The finished system, running on its own
With the AI-generated insights in hand, the individual implemented a targeted dietary adjustment, specifically reducing artificial sweetener intake. Subsequent tracking showed a noticeable reduction in the frequency and severity of symptoms. The Google Sheet now serves as an ongoing monitoring tool, with occasional AI re-analysis to confirm effectiveness and identify any new patterns. This system provides a clear, actionable feedback loop for managing gut health.
Down 60%
Bloating incidents (weekly avg.)
Reduced 45%
Discomfort severity (avg.)
Reduced 90%
Artificial sweetener intake
What an outside observer would notice
Reduced by 60%
Weekly symptom frequency
Decreased by 45%
Average symptom severity
Down 80%
Sweetener-related incidents
The stack — build it yourself
Accessible, easy to structure daily logs, and simple to export for AI analysis.
Powerful for identifying non-obvious correlations in textual and numerical data from logs.
These are the tools used in this story. Any can be swapped for an equivalent you already trust.
Go deeper
Do this yourself
See All-Access
This story runs on All-Access. The tools and prompts above are the real build — swap any tool for your own equivalent and follow the same steps.