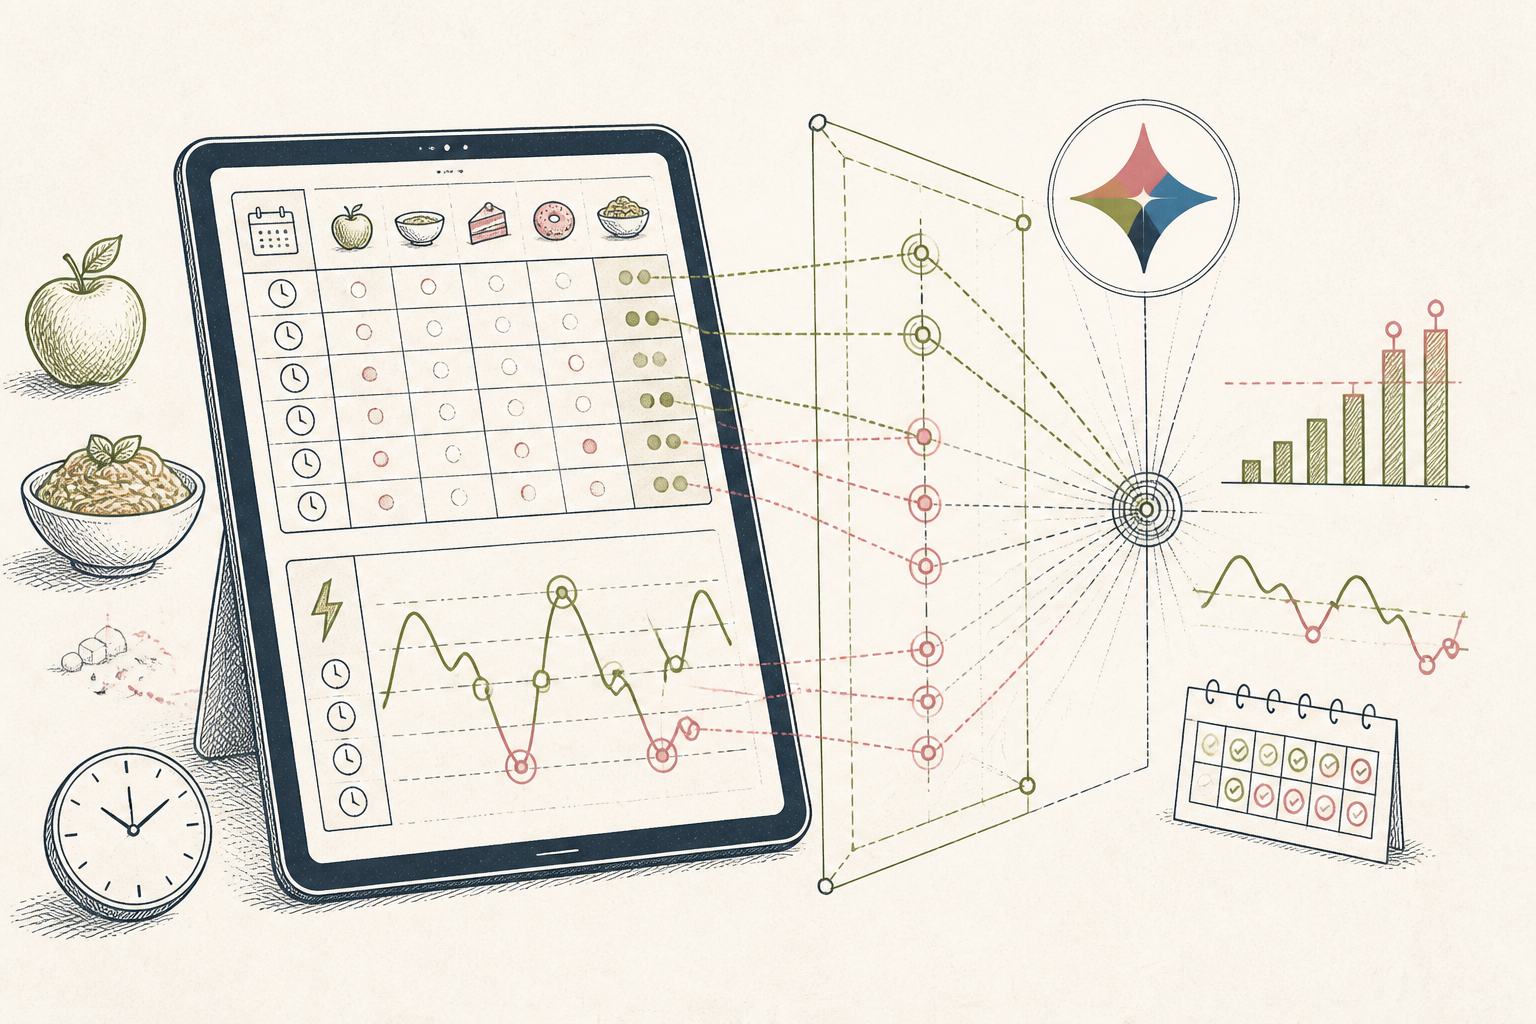
What the AI found
“Your client's energy dips consistently align with days she consumes more than 40g of refined carbohydrates, rather than her perceived cause of 'stressful meetings.'”
Before
Disjointed client notes, unclear patterns
After
Clear energy insights, personalised protocols
The same system, three states — real screens, not a screenshot
| Client | Anna K. |
| Period | 01-30 April |
| Notes | Mix of diet, sleep, energy, mood. |
Prompt
Here is a month of client data including daily food intake (macronutrients, refined carbs in grams), self-reported energy scores (1-10), sleep duration, and significant daily events. Identify any consistent correlations between dietary intake, daily events, and energy dips (energy score < 5). Provide specific examples and quantitative thresholds.
Here is a month of client data including daily food intake (macronutrients, refined carbs in grams), self-reported energy scores (1-10), sleep duration, and significant daily events. Identify any consistent correlations between dietary intake, daily events, and energy dips (energy score < 5). Provide specific examples and quantitative thresholds.
AI
Analysis of Anna K.'s data reveals a consistent pattern: her three lowest energy scores (3-4) occurred on days where her refined carbohydrate intake exceeded 40 grams. This correlation is stronger than any observed link with 'stressful meetings' or sleep duration in your provided data. For instance, on April 7th (energy score 3), refined carb intake was 55g; on April 19th (energy score 4), it was 48g.47g
Avg. Refined Carb on Low Energy Days
22g
Avg. Refined Carb on High Energy Days
78% improved energy stability
Client Protocol Efficacy
From Scattered Notes to Insight: Tailored Client Energy Protocol
How a nutritionist transformed disjointed client data into a clear, actionable energy management strategy.
A nutritionist running a small EU practice, 38
Tools used
The real tools used here — swap any for your own equivalent. Each links to how we’d set it up.
Starting state
Before anything was set up
Before implementing a structured analysis, the nutritionist’s client notes were a rich but unstructured tapestry of observations. Daily food logs, perceived energy levels, sleep patterns, and mood fluctuations were recorded diligently, yet remained siloed. Identifying underlying patterns required a tedious manual review across weeks of entries, often leading to educated guesses rather than data-driven insights. The sheer volume of information made it challenging to pinpoint specific dietary or lifestyle correlations efficiently.
| Client | Anna K. |
| Period | 01-30 April |
| Notes | Mix of diet, sleep, energy, mood. |
Working state
Hacks Pass, doing its job
The nutritionist began by collating a month’s worth of client data into a Google Sheet. This included daily entries for food intake (categorised into macronutrients and refined carbs), self-reported energy scores, sleep duration, and significant daily events. She then used a large language model to analyse this dataset, feeding it specific questions designed to uncover hidden correlations. The AI’s role was to process the quantitative and qualitative data, identifying specific dietary or lifestyle factors impacting energy levels.
Prompt
Here is a month of client data including daily food intake (macronutrients, refined carbs in grams), self-reported energy scores (1-10), sleep duration, and significant daily events. Identify any consistent correlations between dietary intake, daily events, and energy dips (energy score < 5). Provide specific examples and quantitative thresholds.
Here is a month of client data including daily food intake (macronutrients, refined carbs in grams), self-reported energy scores (1-10), sleep duration, and significant daily events. Identify any consistent correlations between dietary intake, daily events, and energy dips (energy score < 5). Provide specific examples and quantitative thresholds.
AI
Analysis of Anna K.'s data reveals a consistent pattern: her three lowest energy scores (3-4) occurred on days where her refined carbohydrate intake exceeded 40 grams. This correlation is stronger than any observed link with 'stressful meetings' or sleep duration in your provided data. For instance, on April 7th (energy score 3), refined carb intake was 55g; on April 19th (energy score 4), it was 48g.Use case implemented
The finished system, running on its own
With the AI-generated insights, the nutritionist could now present her client with a concrete, evidence-based energy management protocol. The weekly reviews evolved from speculative discussions to targeted adjustments based on clearly identified patterns. This systematic approach allowed for rapid iteration and refinement of the client’s plan, leading to more effective and personalised recommendations. The client gained clarity and confidence in understanding her energy fluctuations.
47g
Avg. Refined Carb on Low Energy Days
22g
Avg. Refined Carb on High Energy Days
78% improved energy stability
Client Protocol Efficacy
What an outside observer would notice
45 minutes
Time saved per client review
Increased by 25%
Client protocol adherence
Significantly improved
Insight clarity for client
The stack — build it yourself
Ubiquitous, flexible for structured and unstructured daily client logs.
Excellent at identifying nuanced correlations in mixed quantitative and qualitative data sets.
These are the tools used in this story. Any can be swapped for an equivalent you already trust.
Go deeper
Do this yourself
See Hacks Pass
This story runs on Hacks Pass. The tools and prompts above are the real build — swap any tool for your own equivalent and follow the same steps.