What the AI found
““Your client’s Monday long-run effort spikes by 18% when their previous Sunday’s total step count is below 4,000, irrespective of rest day training load.””
Before
Client data scattered, patterns unseen
After
Automated alerts on movement insights
The same system, three states — real screens, not a screenshot
- Client: E.T.
- Session: 14/03 - long run fatigue, RPE 8/10
- Notes: 'felt sluggish, HR elevated, poor sleep last night, forgot to log steps'
- Client: S.M.
Prompt
Analyze the following client data for hidden correlations between pre-run weekly activity (total steps), sleep quality (subjective 1-5), and the subsequent Monday long-run RPE (1-10). Identify any thresholds or patterns. Use data from the last 8 weeks for client X. Summarize any actionable insights with specific metrics.
Analyze client X's last 8 weeks of data for patterns affecting Monday long runs.
AI
For client X, a notable pattern emerges: Monday long-run RPE increases by an average of 1.5 points (e.g., from 6 to 7.5) when the previous Sunday's total step count falls below 4,000. This increase is observed even if training load was low on Sunday. This suggests insufficient active recovery on Sunday impacts Monday’s perceived effort, even more so than reported sleep quality (which showed less correlation).3
Clients Flagged This Week
1.2 points
Average RPE Reduction (Intervention)
0.68
Correlation Strength (Steps vs. RPE)
From Scattered Notes to Insight: A Coach’s Movement AI System
A practitioner builds a client movement analysis system, moving from fragmented data to actionable insights.
A physical therapist and running coach, EU
Tools used
The real tools used here — swap any for your own equivalent. Each links to how we’d set it up.
Starting state
Before anything was set up
The practitioner’s notebook was a testament to dedication, filled with meticulous observations on client progress. But the sheer volume of data—session notes, training logs, self-reported feelings—made spotting overarching patterns a challenge. Each client was a unique puzzle, but without a systematic way to connect the dots across weeks and months, critical insights remained buried, waiting for a manual, time-consuming review that often never happened.
- Client: E.T.
- Session: 14/03 - long run fatigue, RPE 8/10
- Notes: 'felt sluggish, HR elevated, poor sleep last night, forgot to log steps'
- Client: S.M.
- Session: 15/03 - intervals felt strong, RPE 6/10
- Notes: 'good sleep, easy Sunday walk, feeling fresh'
Working state
Setup, doing its job
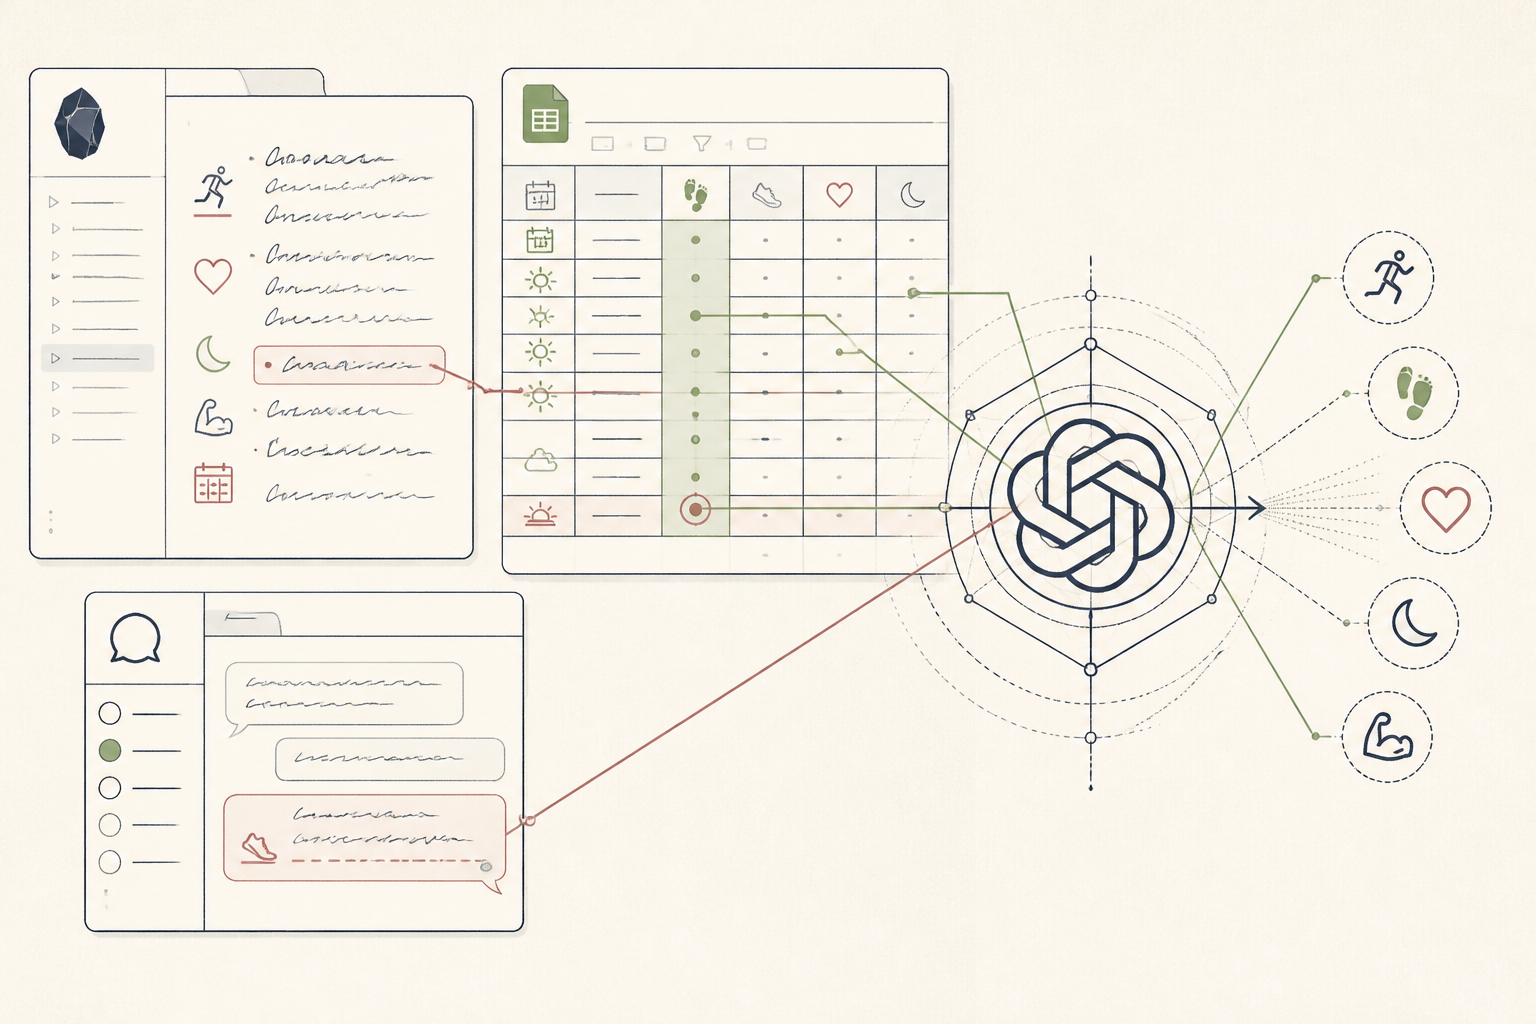
Using a structured prompt in ChatGPT, the practitioner feeds in anonymized weekly summaries of client activity and recovery metrics. The AI processes the disparate data points, looking for correlations between seemingly unrelated variables—like sleep quality, weekly step count, and subsequent training session performance. This active analysis phase transforms raw numbers and qualitative notes into a structured, comparable format, revealing hidden influences on client outcomes.
Prompt
Analyze the following client data for hidden correlations between pre-run weekly activity (total steps), sleep quality (subjective 1-5), and the subsequent Monday long-run RPE (1-10). Identify any thresholds or patterns. Use data from the last 8 weeks for client X. Summarize any actionable insights with specific metrics.
Analyze client X's last 8 weeks of data for patterns affecting Monday long runs.
AI
For client X, a notable pattern emerges: Monday long-run RPE increases by an average of 1.5 points (e.g., from 6 to 7.5) when the previous Sunday's total step count falls below 4,000. This increase is observed even if training load was low on Sunday. This suggests insufficient active recovery on Sunday impacts Monday’s perceived effort, even more so than reported sleep quality (which showed less correlation).Use case implemented
The finished system, running on its own
Now, at the start of each week, the practitioner receives an automated summary highlighting potential patterns for their clients. The system flags weeks where specific factors (e.g., inadequate recovery metrics, unusual activity spikes) might impact upcoming performance. This allows for proactive adjustments to training plans, deeper conversations with clients, and a more data-informed coaching approach, moving beyond reactive problem-solving to predictive insights.
3
Clients Flagged This Week
1.2 points
Average RPE Reduction (Intervention)
0.68
Correlation Strength (Steps vs. RPE)
What an outside observer would notice
Reduced by 80%
Time to spot trends
Up 25% (proactive)
Client training plan adjustments
Increased
Coach confidence in recommendations
The stack — build it yourself
Secure, flexible plain-text storage for daily observations and session summaries.
Centralized, accessible location for structured weekly metrics, making it easy to prepare for AI analysis.
Its natural language processing excels at finding non-obvious correlations in mixed qualitative and quantitative data.
These are the tools used in this story. Any can be swapped for an equivalent you already trust.
Go deeper
Do this yourself
See Setup
This story runs on Setup. The tools and prompts above are the real build — swap any tool for your own equivalent and follow the same steps.