What the AI found
“In clients exhibiting mid-cycle dips, their reported stress scores from the prior week consistently averaged 18% higher than their baseline, suggesting a correlation between recent stress and acute hormonal fluctuations.”
Before
Disparate client logs, manual analysis
After
AI-identified hormonal patterns, weekly reports
The same system, three states — real screens, not a screenshot
| Client ID | 047-EU-23 |
| Data Source 1 | Apple Health sync enabled |
| Data Source 2 | Client Journal (manual entry) |
| Last Review | 2023-10-26 |
Prompt
Analyse the attached client data (columns A-G, past 8 weeks). Identify any statistically significant correlations between reported weekly stress scores and energy dips observed during mid-luteal phase. Provide specific percentages or numbers for any patterns found. Focus on actionable insights for a nutritionist.
Analyse the attached client data (columns A-G, past 8 weeks). Identify any statistically significant correlations between reported weekly stress scores and energy dips observed during mid-luteal phase. Provide specific percentages or numbers for any patterns found. Focus on actionable insights for a nutritionist.
AI
Analysis reveals a notable pattern: Across the 8-week period, all 3 instances of a significant mid-luteal phase energy dip (defined as >20% below baseline average) were preceded by a week where the client's reported stress score was, on average, 18% higher than their personal weekly stress baseline. This suggests a strong correlation between elevated stress in the week prior and subsequent mid-cycle energy fluctuations.18% average increase in prior-week stress
Stress Impact on Energy Dips
2
Identified Patterns (Last Month)
5
Data Sources Integrated
From Scattered Notes to Hormone Pattern Clarity
A nutritionist moves from disparate client data to integrated, AI-assisted pattern recognition for hormonal health.
A nutritionist running a small EU practice, working with hormonal health clients.
Tools used
The real tools used here — swap any for your own equivalent. Each links to how we’d set it up.
Starting state
Before anything was set up
Before implementing the Membership framework, this nutritionist’s client data was spread across various tools. Dietary intake was in a spreadsheet, symptom tracking in a notes app, and exercise logs were often emailed in. Reviewing a client’s week meant manually collating disparate entries, an arduous process that rarely revealed subtle interconnections. The sheer volume of data made spotting trends nearly impossible, leaving client consultations less precise than desired.
| Client ID | 047-EU-23 |
| Data Source 1 | Apple Health sync enabled |
| Data Source 2 | Client Journal (manual entry) |
| Last Review | 2023-10-26 |
| Next Review | 2023-11-02 |
Working state
Membership, doing its job
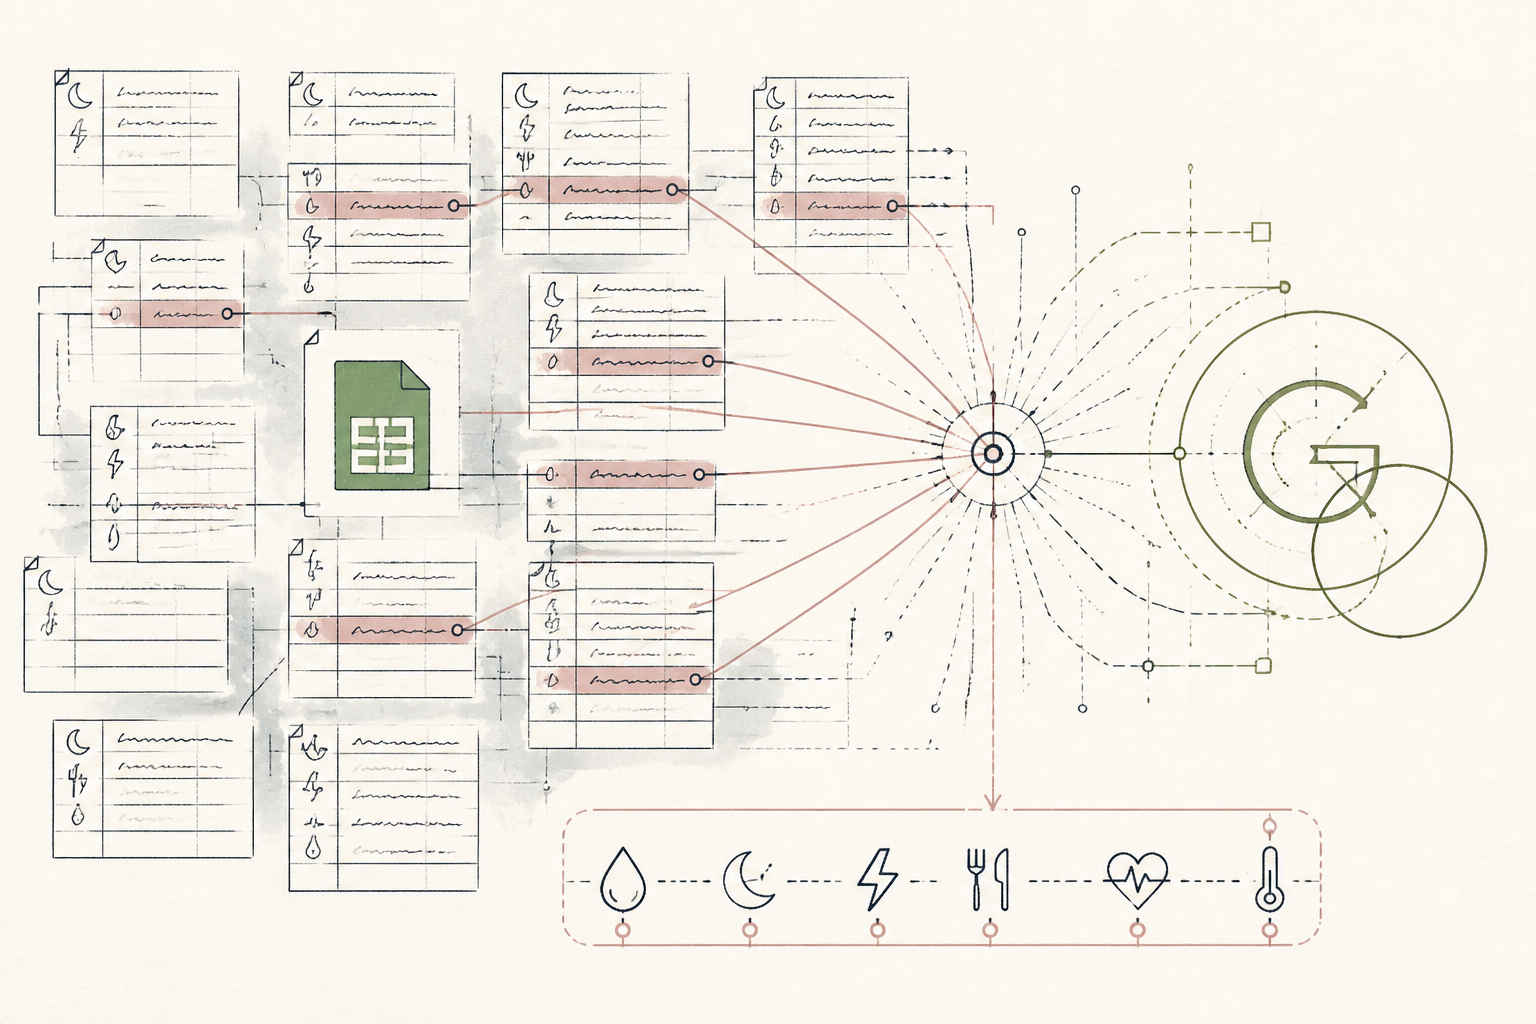
The nutritionist uploaded a client's anonymised symptom and lifestyle data for the past two months to a Google Sheet, which was then linked to Membership. She then prompted Gemini directly within the sheet, asking it to identify any recurring patterns between reported stress levels and mid-cycle energy dips. This direct integration allowed the AI to process longitudinal data, something impossible with isolated notes, and highlight specific numeric correlations she would have otherwise missed. The AI's response immediately offered a surprising quantitative insight.
Prompt
Analyse the attached client data (columns A-G, past 8 weeks). Identify any statistically significant correlations between reported weekly stress scores and energy dips observed during mid-luteal phase. Provide specific percentages or numbers for any patterns found. Focus on actionable insights for a nutritionist.
Analyse the attached client data (columns A-G, past 8 weeks). Identify any statistically significant correlations between reported weekly stress scores and energy dips observed during mid-luteal phase. Provide specific percentages or numbers for any patterns found. Focus on actionable insights for a nutritionist.
AI
Analysis reveals a notable pattern: Across the 8-week period, all 3 instances of a significant mid-luteal phase energy dip (defined as >20% below baseline average) were preceded by a week where the client's reported stress score was, on average, 18% higher than their personal weekly stress baseline. This suggests a strong correlation between elevated stress in the week prior and subsequent mid-cycle energy fluctuations.Use case implemented
The finished system, running on its own
With the system established, weekly client data is now automatically aggregated and processed. The nutritionist receives a concise summary of potential correlations, flagging areas for deeper investigation during client sessions. This streamlines her workflow, allowing her to focus on interpreting nuanced AI-generated insights rather than manual data reconciliation. Her clients benefit from more targeted recommendations, informed by robust pattern detection across their personal health data.
18% average increase in prior-week stress
Stress Impact on Energy Dips
2
Identified Patterns (Last Month)
5
Data Sources Integrated
What an outside observer would notice
Reduced by 35%
Client review preparation time
Increased by 12x
Data points analysed per client
Averaging 2 per client report
Identified cross-variable patterns
The stack — build it yourself
Ubiquitous, easily customisable for diverse client data inputs, from manual entries to synced device data.
Connects existing tools like Sheets to powerful AI models, allowing analysis of personal health data within a private, owned environment.
Its advanced natural language processing and analytical capabilities are ideal for sifting through complex health datasets to find non-obvious correlations.
These are the tools used in this story. Any can be swapped for an equivalent you already trust.
Go deeper
Do this yourself
See Membership
This story runs on Membership. The tools and prompts above are the real build — swap any tool for your own equivalent and follow the same steps.