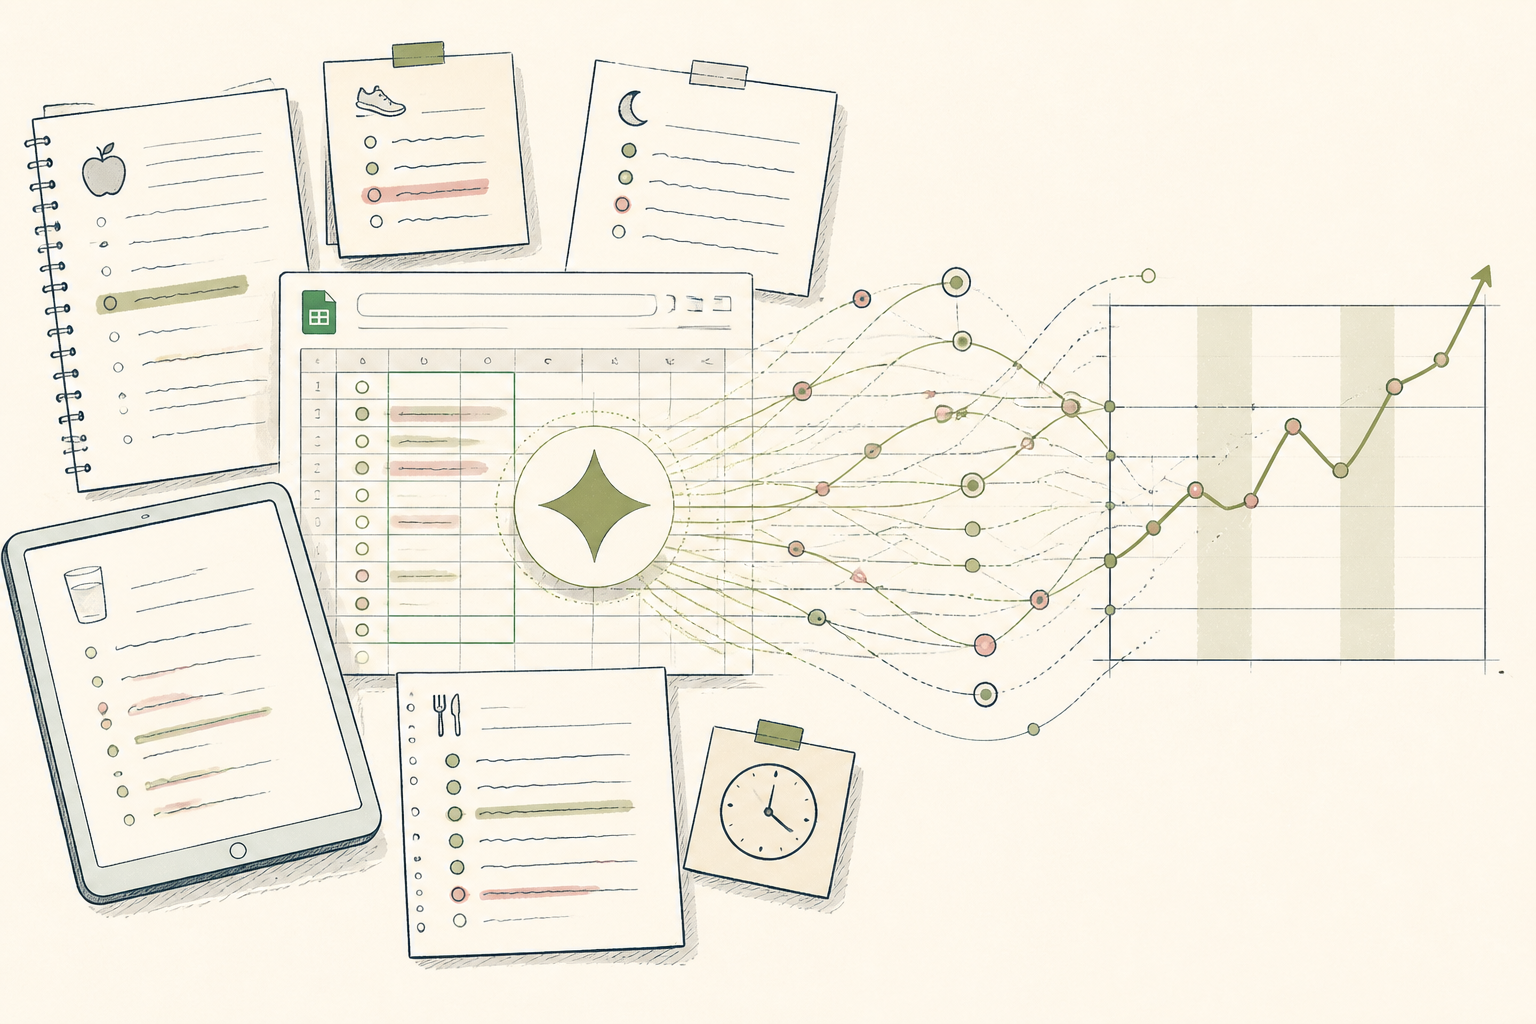
What the AI found
“AI: "Your early morning blood glucose consistently peaks on days following a late dinner with more than 30g of carbohydrates, averaging 14% higher than other days."”
Before
Disparate health logs, no clear insights
After
One weekly review, targeted adjustments
The same system, three states — real screens, not a screenshot
| Date | BG (mmol/L) — Dinner Carbs (g) — Dinner Time |
| 2023-10-26 | 6.1 — 45 — 20:30 |
| 2023-10-27 | 5.4 — 20 — 18:45 |
| 2023-10-28 | 6.8 — 55 — 21:00 |
Prompt
Here is my last month of daily health data: [insert spreadsheet data here, columns: Date, Morning Blood Glucose (mmol/L), Dinner Carbohydrates (g), Dinner Time (HH:MM)]. Can you identify any non-obvious patterns or correlations between dinner specifics and morning blood glucose, especially focusing on late meals or higher carb intake?
Here is my last month of daily health data: [insert spreadsheet data here, columns: Date, Morning Blood Glucose (mmol/L), Dinner Carbohydrates (g), Dinner Time (HH:MM)]. Can you identify any non-obvious patterns or correlations between dinner specifics and morning blood glucose, especially focusing on late meals or higher carb intake?
AI
Upon reviewing your data, a notable pattern emerges: your morning blood glucose readings are consistently higher following dinners consumed after 8 PM with more than 30g of carbohydrates. On these specific days, your average morning blood glucose is 6.5 mmol/L, which is 14% higher than your overall average of 5.7 mmol/L on days with earlier or lower-carb dinners.6.5 mmol/L
Avg BG (late, high carb)
5.7 mmol/L
Avg BG (other days)
14% higher
Difference
From Scattered Notes to a Clear Metabolic Trend
A 54-year-old learns how AI can illuminate subtle patterns in daily health data.
A 54-year-old former teacher, Northern Europe, keen to understand her metabolic health better.
Tools used
The real tools used here — swap any for your own equivalent. Each links to how we’d set it up.
Starting state
Before anything was set up
For months, Maria meticulously logged her blood glucose, diet, and activity into various apps and notebooks. Despite the effort, she felt overwhelmed by the sheer volume of data. Each morning brought a new number, but the underlying patterns remained elusive, leaving her unsure how to adjust her habits effectively.
| Date | BG (mmol/L) — Dinner Carbs (g) — Dinner Time |
| 2023-10-26 | 6.1 — 45 — 20:30 |
| 2023-10-27 | 5.4 — 20 — 18:45 |
| 2023-10-28 | 6.8 — 55 — 21:00 |
| 2023-10-29 | 5.2 — 15 — 19:15 |
Working state
Setup, doing its job
Using a simple prompt in Google Gemini, Maria fed it structured data from her Google Sheet. The goal was to identify any non-obvious correlations between her evening meals and morning blood glucose readings, something too complex to spot manually. The AI quickly sifted through weeks of entries, returning a specific, actionable insight.
Prompt
Here is my last month of daily health data: [insert spreadsheet data here, columns: Date, Morning Blood Glucose (mmol/L), Dinner Carbohydrates (g), Dinner Time (HH:MM)]. Can you identify any non-obvious patterns or correlations between dinner specifics and morning blood glucose, especially focusing on late meals or higher carb intake?
Here is my last month of daily health data: [insert spreadsheet data here, columns: Date, Morning Blood Glucose (mmol/L), Dinner Carbohydrates (g), Dinner Time (HH:MM)]. Can you identify any non-obvious patterns or correlations between dinner specifics and morning blood glucose, especially focusing on late meals or higher carb intake?
AI
Upon reviewing your data, a notable pattern emerges: your morning blood glucose readings are consistently higher following dinners consumed after 8 PM with more than 30g of carbohydrates. On these specific days, your average morning blood glucose is 6.5 mmol/L, which is 14% higher than your overall average of 5.7 mmol/L on days with earlier or lower-carb dinners.Use case implemented
The finished system, running on its own
Now, Maria dedicates ten minutes each Sunday to reviewing her week's data in a consolidated Google Sheet. With a refined prompt, she receives concise summaries and pattern recognition from Gemini, allowing her to make informed decisions about her diet and activity for the week ahead. The guesswork is gone, replaced by clarity.
6.5 mmol/L
Avg BG (late, high carb)
5.7 mmol/L
Avg BG (other days)
14% higher
Difference
What an outside observer would notice
10 minutes
Weekly review time
Reduced by 80%
Guesswork on diet
The stack — build it yourself
Familiar, flexible for varied health metrics, and easily exportable for AI analysis.
Excellent at identifying subtle correlations in tabular data without complex statistical software.
These are the tools used in this story. Any can be swapped for an equivalent you already trust.
Go deeper
Do this yourself
Discover your own health patterns
This story runs on Setup. The tools and prompts above are the real build — swap any tool for your own equivalent and follow the same steps.