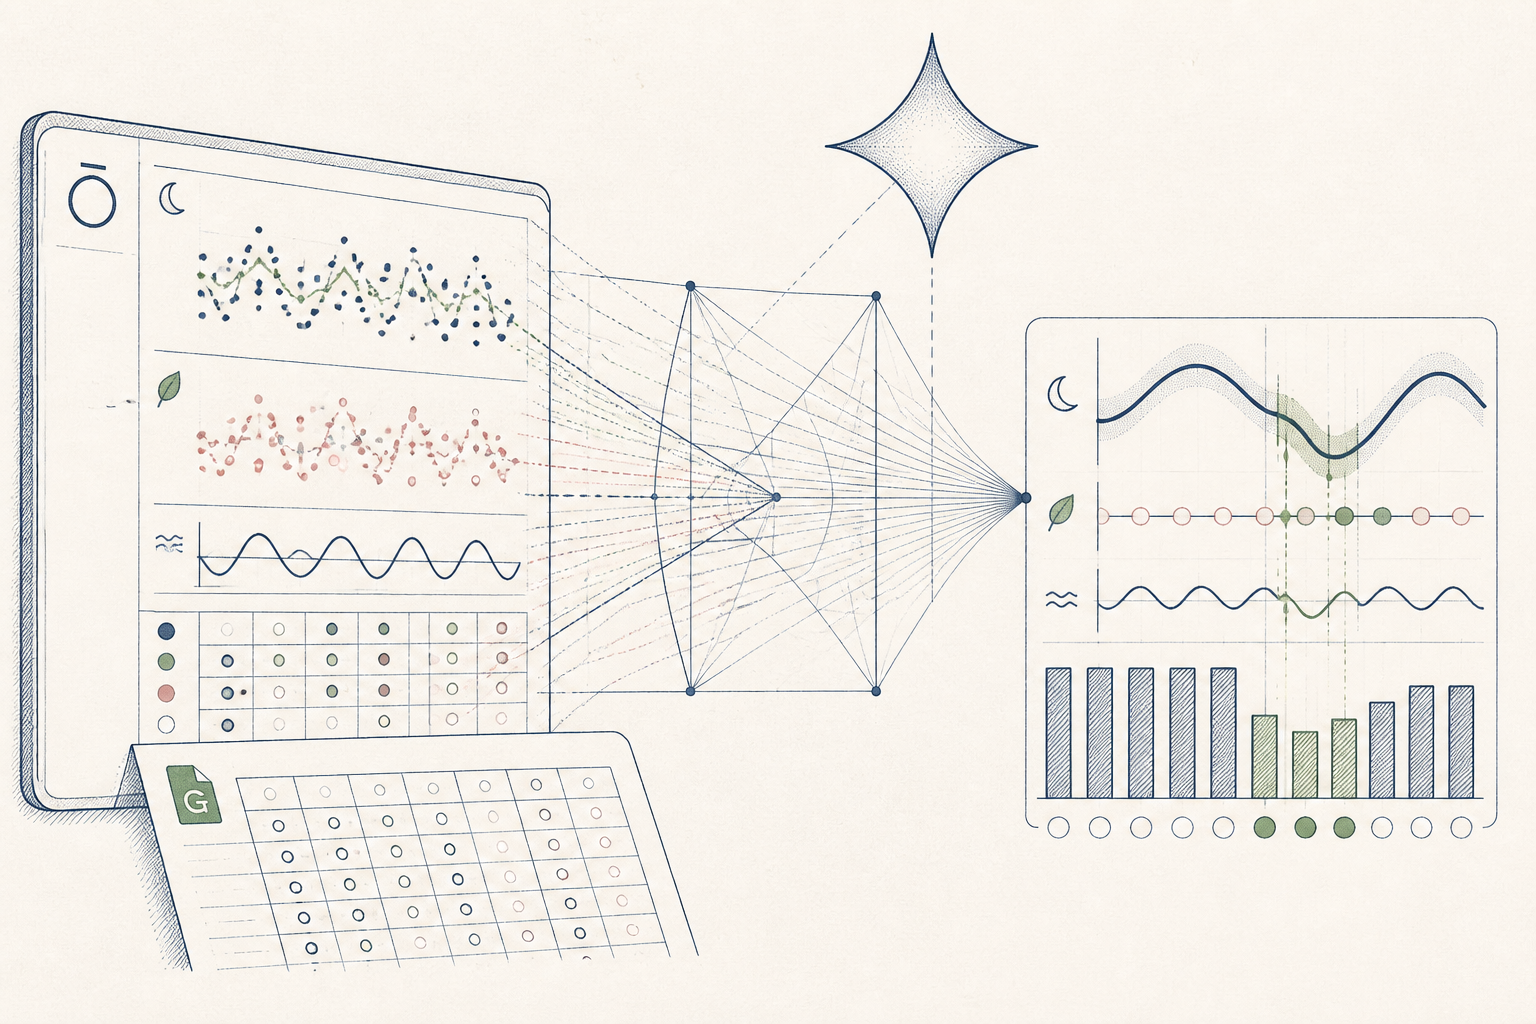
What the AI found
“Your cycle data reveals a consistent pattern: the three nights preceding your most symptomatic luteal days show an average of 45 minutes less REM sleep than your cycle average. This suggests a quantifiable sleep-symptom link.”
Before
Disparate cycle data, no clear patterns
After
Clear weekly symptom insights, improved energy management
The same system, three states — real screens, not a screenshot
| Date | Symptom Severity (1-5) — Sleep Duration (hr) — REM Sleep (min) |
| 2023-10-15 | 4 — 7.2 — 85 |
| 2023-10-16 | 3 — 7.5 — 92 |
| 2023-10-17 | 5 — 6.8 — 70 |
Prompt
Here is 90 days of my anonymised cycle, sleep (total and REM), and mood data. Each row includes date, cycle day, symptom severity (1-5), total sleep duration (hours), REM sleep (minutes), and daily mood. Identify any consistent correlations between sleep metrics and symptom severity, especially during the luteal phase. Quantify any patterns you find.
Here is 90 days of my anonymised cycle, sleep (total and REM), and mood data. Each row includes date, cycle day, symptom severity (1-5), total sleep duration (hours), REM sleep (minutes), and daily mood. Identify any consistent correlations between sleep metrics and symptom severity, especially during the luteal phase. Quantify any patterns you find.
AI
Upon reviewing your 90 days of data, a notable pattern emerges: the three nights immediately preceding your most symptomatic luteal days (severity 4-5) show a consistent reduction in REM sleep. Specifically, these nights averaged 75 minutes of REM sleep, which is 45 minutes less than your overall cycle average of 120 minutes of REM sleep. Total sleep duration did not show a similar significant correlation. This suggests a quantifiable link between reduced REM sleep and heightened luteal phase symptoms.118 min
Last 7 days REM avg
Low (2)
Luteal Phase Symptom Score (predicted)
88/100
Deep Sleep Score (last night)
From Scattered Cycle Data to a Clear Weekly Pattern
A 38-year-old learns how her sleep impacts her cycle symptoms, moving from vague observations to clear, actionable insights for weekly planning.
A 38-year-old project manager, Northern Europe, tracking her cycle for general wellbeing.
Tools used
The real tools used here — swap any for your own equivalent. Each links to how we’d set it up.
Starting state
Before anything was set up
Before implementing the Wellness & AI hormone resource, our subject, a project manager in Northern Europe, maintained a digital labyrinth of cycle notes, sleep data, and daily mood entries across several apps. She diligently recorded, but the sheer volume of disconnected information left her feeling overwhelmed. Identifying any actionable patterns felt like sifting through sand, making proactive planning impossible. Every month felt like a surprise, despite her efforts to track.
| Date | Symptom Severity (1-5) — Sleep Duration (hr) — REM Sleep (min) |
| 2023-10-15 | 4 — 7.2 — 85 |
| 2023-10-16 | 3 — 7.5 — 92 |
| 2023-10-17 | 5 — 6.8 — 70 |
| 2023-10-18 | 2 — 7.9 — 100 |
Working state
Resources, doing its job
Using the Wellness & AI "Cycle Symptom Correlation" resource, she structured her scattered data into a Google Sheet. The resource provided a clear prompt, which she copied verbatim into Gemini. She uploaded 90 days of anonymised cycle, sleep, and mood data. Gemini then analysed the correlations, surfacing the unexpected finding about REM sleep and luteal phase symptoms. This step transformed raw numbers into a surprising, concrete insight.
Prompt
Here is 90 days of my anonymised cycle, sleep (total and REM), and mood data. Each row includes date, cycle day, symptom severity (1-5), total sleep duration (hours), REM sleep (minutes), and daily mood. Identify any consistent correlations between sleep metrics and symptom severity, especially during the luteal phase. Quantify any patterns you find.
Here is 90 days of my anonymised cycle, sleep (total and REM), and mood data. Each row includes date, cycle day, symptom severity (1-5), total sleep duration (hours), REM sleep (minutes), and daily mood. Identify any consistent correlations between sleep metrics and symptom severity, especially during the luteal phase. Quantify any patterns you find.
AI
Upon reviewing your 90 days of data, a notable pattern emerges: the three nights immediately preceding your most symptomatic luteal days (severity 4-5) show a consistent reduction in REM sleep. Specifically, these nights averaged 75 minutes of REM sleep, which is 45 minutes less than your overall cycle average of 120 minutes of REM sleep. Total sleep duration did not show a similar significant correlation. This suggests a quantifiable link between reduced REM sleep and heightened luteal phase symptoms.Use case implemented
The finished system, running on its own
With the pattern identified, she now uses her Oura ring data and a simple Google Sheet each week. On Sunday, she quickly checks her REM sleep trends and adjusts her schedule, particularly during the luteal phase. If REM sleep has been low, she prioritises earlier nights and lighter workouts, reporting more consistent energy levels. The system now runs on its own, providing a reliable, proactive guide to her cycle rather than a reactive scramble.
118 min
Last 7 days REM avg
Low (2)
Luteal Phase Symptom Score (predicted)
88/100
Deep Sleep Score (last night)
What an outside observer would notice
75 minutes
Average REM Sleep (prior to symptomatic days)
Up 60%
Proactive planning confidence
Down 70%
Symptom surprise events
The stack — build it yourself
Accessible, flexible for custom data entry, and easy to export for AI analysis.
Provides detailed, consistent sleep stage data (including REM) without user input.
Capable of processing structured data and identifying non-obvious correlations with a clear, concise output.
These are the tools used in this story. Any can be swapped for an equivalent you already trust.
Go deeper
Do this yourself
See Resources
This story runs on Resources. The tools and prompts above are the real build — swap any tool for your own equivalent and follow the same steps.