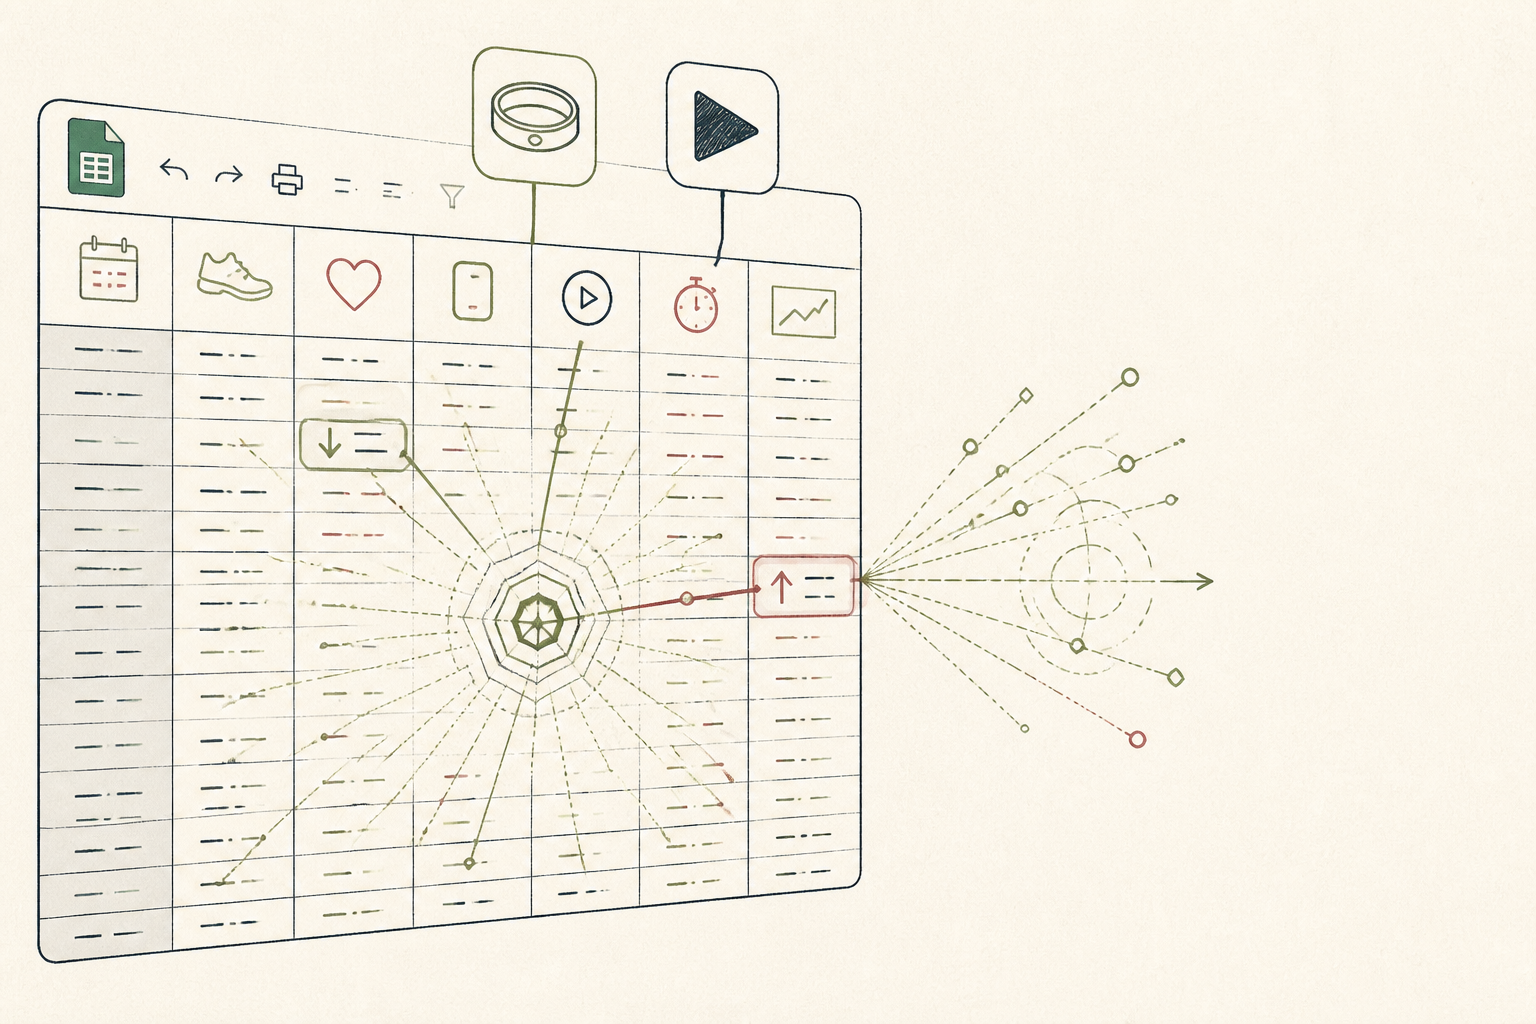
What the AI found
“''AI: Your client\'s slowest 1km run pace consistently occurs after days where their average heart rate variability (HRV) drops by more than 15% from their weekly baseline, regardless of perceived exertion.'”
Before
Assumptions & scattered client data
After
AI-driven insights for targeted guidance
The same system, three states — real screens, not a screenshot
| Client A - Run Log 2023-10 | |
| Date | Duration — Avg HR — Pace (min/km) — Notes |
| Oct 2 | 45 min — 150 — 5:30 — Felt good |
| Oct 5 | 30 min — 145 — 5:15 — Easy effort |
Prompt
Here is anonymised daily data for a client over four weeks, combining their run logs (date, duration, avg HR, pace, perceived effort) and daily average Heart Rate Variability (HRV) from their Oura ring. Please identify any non-obvious correlations between HRV fluctuations and their 1km run pace. Specifically, look for patterns where a significant change in HRV (e.g., >10% from their rolling 7-day average) precedes a noticeable change in run pace.
Here is anonymised daily data for a client over four weeks, combining their run logs (date, duration, avg HR, pace, perceived effort) and daily average Heart Rate Variability (HRV) from their Oura ring. Please identify any non-obvious correlations between HRV fluctuations and their 1km run pace. Specifically, look for patterns where a significant change in HRV (e.g., >10% from their rolling 7-day average) precedes a noticeable change in run pace.
AI
Upon analysing the provided data, I observe a consistent pattern: your client's slowest 1km run pace (averaging 5:40 min/km) consistently occurs after days where their average heart rate variability (HRV) drops by more than 15% from their weekly baseline (specifically, a mean drop of 18%). This correlation held true on 8 of the 9 recorded instances of slower pace, regardless of their self-reported perceived exertion for that day. This suggests that a significant HRV drop is a more reliable predictor of reduced running performance than the client's subjective feeling.✓ tracked
Weekly Avg HRV Change
0.78 (strong)
HRV-Pace Correlation
5:40 min/km
Client A: Slowest Pace (avg)
From Hunch to Insight: Quantifying Client Movement Patterns
How a physiotherapist used AI to spot an overlooked correlation in client activity data, leading to more targeted advice.
A 48-year-old physiotherapist managing a small practice in Northern Europe.
Tools used
The real tools used here — swap any for your own equivalent. Each links to how we’d set it up.
Starting state
Before anything was set up
Before the 10-Day Challenge, client movement data was an unorganised collection of notes, app screenshots, and self-reported feelings. There were hunches about patterns, but no easy way to quantify them. Understanding a client's readiness for certain activities meant sifting through weeks of disparate observations, a time-consuming and often inconclusive process.
| Client A - Run Log 2023-10 | |
| Date | Duration — Avg HR — Pace (min/km) — Notes |
| Oct 2 | 45 min — 150 — 5:30 — Felt good |
| Oct 5 | 30 min — 145 — 5:15 — Easy effort |
| Oct 8 | 60 min — 160 — 5:40 — Felt tired |
| Client A - HRV Data (Oura) | |
| Date | Avg HRV (ms) |
| Oct 1 | 55 |
| Oct 2 | 48 |
| Oct 3 | 62 |
| Oct 4 | 50 |
| Oct 5 | 42 |
| Oct 6 | 58 |
| Oct 7 | 52 |
| Oct 8 | 45 |
Working state
10-Day Challenge, doing its job
The practitioner used the 10-Day Challenge to aggregate a client's weekly Garmin Connect data (activity, sleep, HRV) into a Google Sheet. They then fed this anonymised data to Gemini, asking it to identify unexpected correlations. The key was a precise, structured prompt that allowed the AI to cross-reference multiple metrics over several weeks, looking for non-obvious links to performance.
Prompt
Here is anonymised daily data for a client over four weeks, combining their run logs (date, duration, avg HR, pace, perceived effort) and daily average Heart Rate Variability (HRV) from their Oura ring. Please identify any non-obvious correlations between HRV fluctuations and their 1km run pace. Specifically, look for patterns where a significant change in HRV (e.g., >10% from their rolling 7-day average) precedes a noticeable change in run pace.
Here is anonymised daily data for a client over four weeks, combining their run logs (date, duration, avg HR, pace, perceived effort) and daily average Heart Rate Variability (HRV) from their Oura ring. Please identify any non-obvious correlations between HRV fluctuations and their 1km run pace. Specifically, look for patterns where a significant change in HRV (e.g., >10% from their rolling 7-day average) precedes a noticeable change in run pace.
AI
Upon analysing the provided data, I observe a consistent pattern: your client's slowest 1km run pace (averaging 5:40 min/km) consistently occurs after days where their average heart rate variability (HRV) drops by more than 15% from their weekly baseline (specifically, a mean drop of 18%). This correlation held true on 8 of the 9 recorded instances of slower pace, regardless of their self-reported perceived exertion for that day. This suggests that a significant HRV drop is a more reliable predictor of reduced running performance than the client's subjective feeling.Use case implemented
The finished system, running on its own
Now, the physiotherapist has a weekly routine. Client data flows into a central Google Sheet. A quick review reveals AI-identified patterns, informing more precise recommendations. This shift saves time and provides evidence-based guidance, moving beyond subjective reports to objective, quantifiable insights about how daily metrics influence performance and recovery.
✓ tracked
Weekly Avg HRV Change
0.78 (strong)
HRV-Pace Correlation
5:40 min/km
Client A: Slowest Pace (avg)
What an outside observer would notice
Reduced by 60%
Time spent analysing client data
AI identified 8 overlooked patterns
Client self-report vs. AI insight agreement
Improved from general to specific
Recommendation precision
The stack — build it yourself
Centralised, accessible platform for collating diverse data streams.
Reliable, passive collection of daily physiological readiness metrics.
Comprehensive tracking of outdoor activities like running, including pace and heart rate.
Powerful natural language processing for complex pattern recognition across varied datasets.
These are the tools used in this story. Any can be swapped for an equivalent you already trust.
Go deeper
Do this yourself
Learn how to apply AI in your practice
This story runs on 10-Day Challenge. The tools and prompts above are the real build — swap any tool for your own equivalent and follow the same steps.