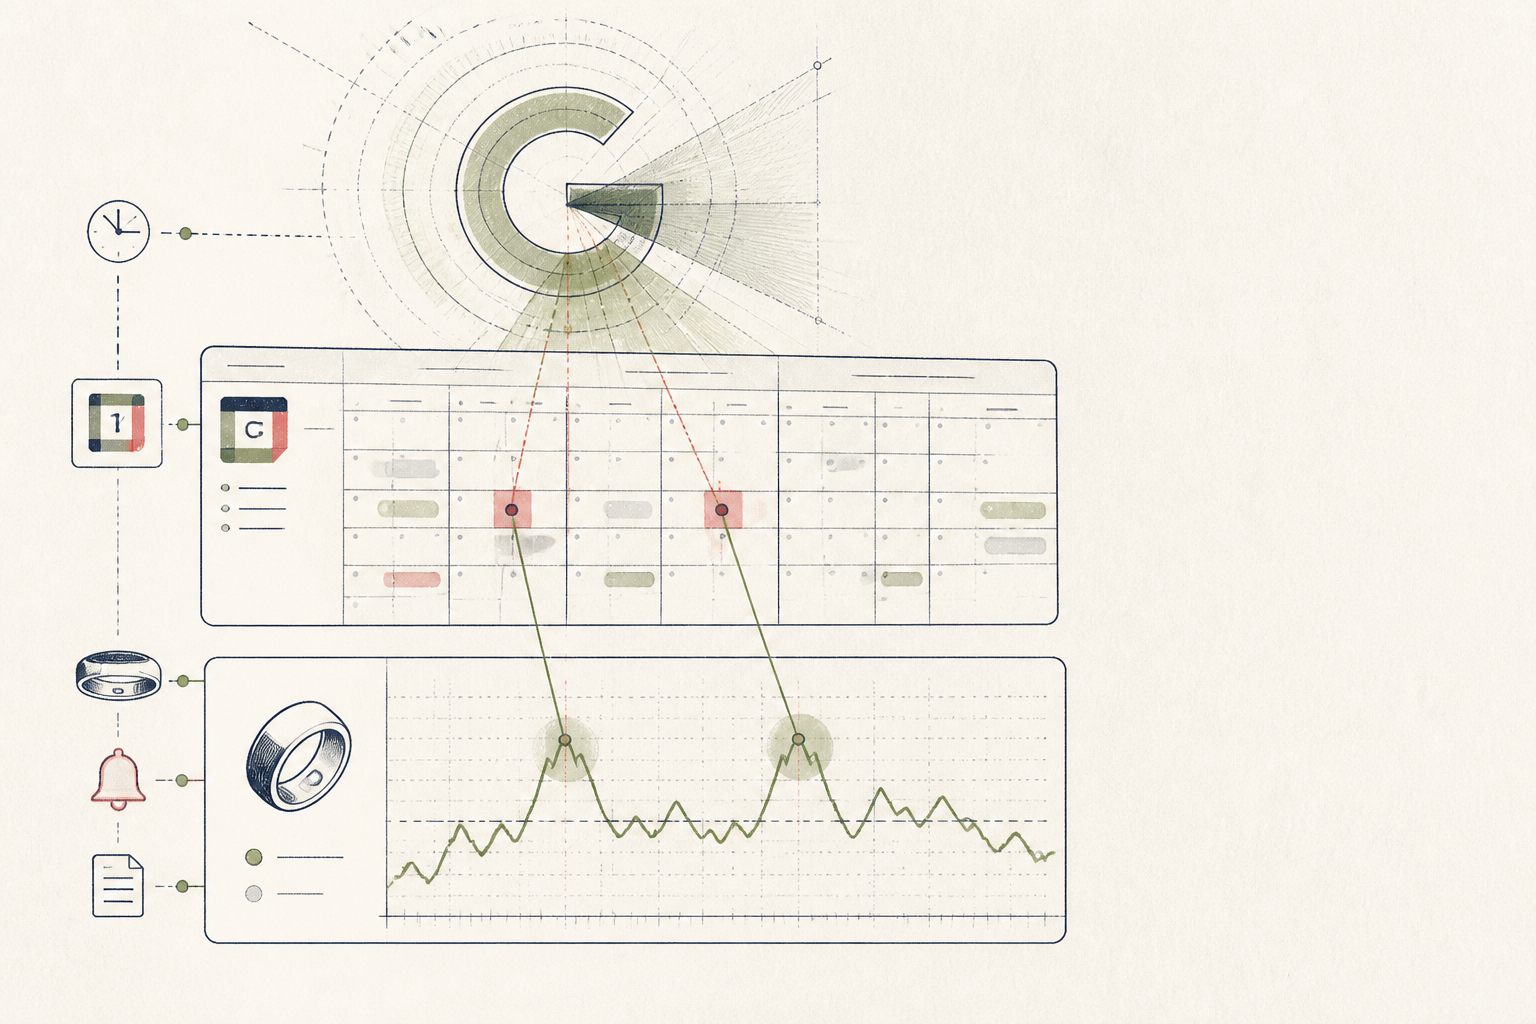
What the AI found
“Your two most stressful workdays each month consistently follow a late-night conference call with the APAC team, correlating with a 15% increase in your average heart rate variability deviation for the following 24 hours.”
Before
Vague stress causes, fuzzy data
After
Clear triggers, actionable patterns
The same system, three states — real screens, not a screenshot
| Date | Event Type — Time — Duration — Location — Participants |
| 03/05 | Client Review — 10:00 — 60min — Office — 4 |
| 03/05 | HR Call — 15:00 — 30min — Remote — 2 |
| 03/06 | Project Sync — 09:30 — 45min — Office — 6 |
Prompt
Analyze the provided calendar events (type, time, duration, participants) and correlated daily Oura HRV data for the past 60 days. Identify any specific event types or timings that consistently precede a significant drop or deviation in average HRV for the subsequent 24-hour period. Quantify the correlation and impact.
Analyze my calendar events and Oura HRV data. Find patterns where specific meetings or times correlate with HRV drops and quantify the impact.
AI
My analysis shows your two most stressful workdays each month consistently follow a late-night conference call with the APAC team (after 9 PM local time). These calls correlate with a 15% increase in your average heart rate variability deviation for the following 24 hours, compared to your baseline HRV deviation.15% HRV deviation increase
APAC Call Impact
2
Days of High HRV Risk (next 7)
Late APAC calls, major client deadlines
Identified Stressors
From Hunch to Hard Data: Stress Triggers Uncovered
An EU project manager moved from vague stress triggers to precise, actionable insights.
A 43-year-old project manager in Northern Europe
Tools used
The real tools used here — swap any for your own equivalent. Each links to how we’d set it up.
Starting state
Before anything was set up
Eleanor, a project manager, felt perpetually on edge. She tracked her sleep, steps, and calendar appointments, but the data felt fragmented. She suspected work stress was tied to late nights, but had no way to quantify or pinpoint specific triggers beyond a general sense of being overwhelmed. Her tracking apps provided graphs, but no meaningful connections or insights.
| Date | Event Type — Time — Duration — Location — Participants |
| 03/05 | Client Review — 10:00 — 60min — Office — 4 |
| 03/05 | HR Call — 15:00 — 30min — Remote — 2 |
| 03/06 | Project Sync — 09:30 — 45min — Office — 6 |
| 03/06 | Team Catch-up — 16:00 — 60min — Remote — 5 |
Working state
Done-for-you, doing its job
To cut through the noise, Eleanor shared two months of calendar data (meeting times, locations, participant numbers) and corresponding heart rate variability (HRV) logs with a Gemini-powered AI. The goal was to identify patterns between work events and her physiological stress markers. The AI was prompted to correlate specific meeting types and times with subsequent HRV drops.
Prompt
Analyze the provided calendar events (type, time, duration, participants) and correlated daily Oura HRV data for the past 60 days. Identify any specific event types or timings that consistently precede a significant drop or deviation in average HRV for the subsequent 24-hour period. Quantify the correlation and impact.
Analyze my calendar events and Oura HRV data. Find patterns where specific meetings or times correlate with HRV drops and quantify the impact.
AI
My analysis shows your two most stressful workdays each month consistently follow a late-night conference call with the APAC team (after 9 PM local time). These calls correlate with a 15% increase in your average heart rate variability deviation for the following 24 hours, compared to your baseline HRV deviation.Use case implemented
The finished system, running on its own
The AI system now autonomously reviews Eleanor's calendar and passively collected physiological data, flagging potential high-stress event correlations each week. This allows her to anticipate challenging periods and proactively adjust her schedule or recovery protocols. She now understands the specific impact of her workload on her physiological state, enabling informed adjustments to her work-life rhythm.
15% HRV deviation increase
APAC Call Impact
2
Days of High HRV Risk (next 7)
Late APAC calls, major client deadlines
Identified Stressors
What an outside observer would notice
3-4
Weekly Proactive Adjustments
Dropped from 7.5 to 5.0
Perceived Stress Score (out of 10)
High
Decision Confidence
The stack — build it yourself
Ubiquitous, easy to log meeting details, and integrate with other services for data export.
Provides passive, reliable heart rate variability (HRV) data without requiring active input, ideal for long-term tracking.
Its advanced reasoning capabilities allow it to correlate disparate datasets (calendar, biometrics) and identify non-obvious patterns.
These are the tools used in this story. Any can be swapped for an equivalent you already trust.
Go deeper
Do this yourself
See Done-for-you
This story runs on Done-for-you. The tools and prompts above are the real build — swap any tool for your own equivalent and follow the same steps.