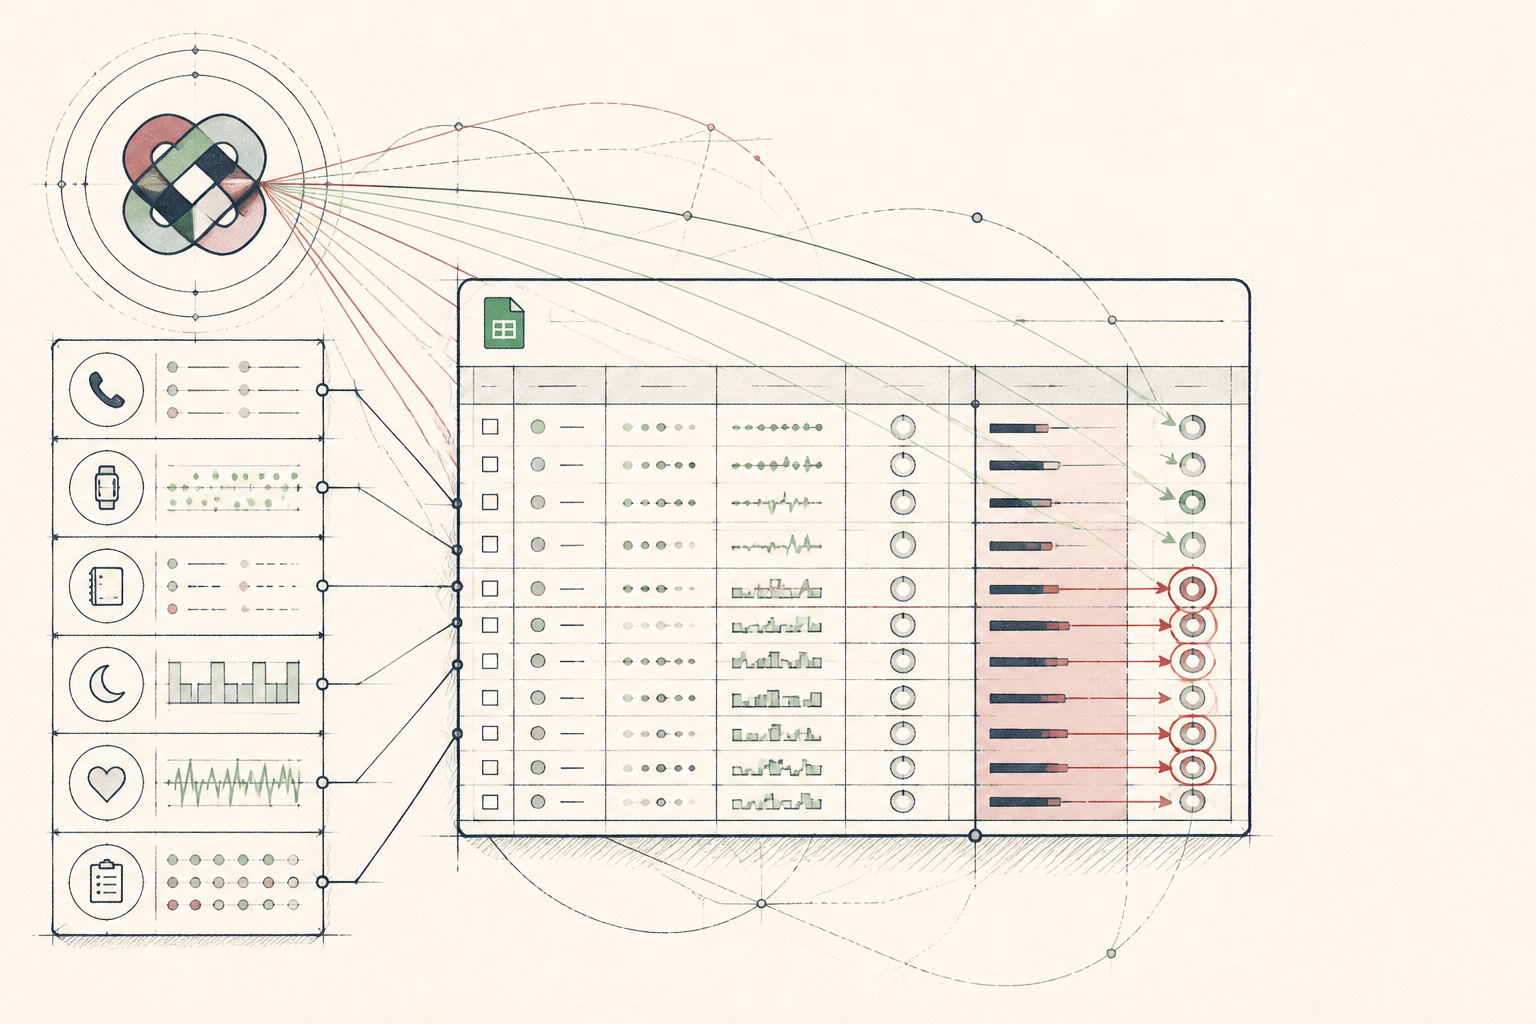
What the AI found
“AI found that clients consistently logged 15-20% lower subjective recovery scores on days following client calls exceeding 45 minutes, a pattern previously attributed to training load.”
Before
Intuitive weekly adjustments
After
Data-driven micro-adjustments in minutes
The same system, three states — real screens, not a screenshot
| Client A (week 3) | low recovery score |
| Notes | 'Felt drained', 'long day of calls' |
| Training | low intensity |
| Client B (week 5) | low recovery score |
Prompt
Analyze the provided anonymized client data from the last two months. Correlate subjective recovery scores (1-10 scale) with non-training daily activities. Look for statistically significant patterns where recovery scores drop following specific non-training events. Specifically, examine time spent on client calls, administrative tasks, and digital screen time outside of work. Return any patterns with quantified impact.
Analyze the provided anonymized client data from the last two months. Correlate subjective recovery scores (1-10 scale) with non-training daily activities. Look for statistically significant patterns where recovery scores drop following specific non-training events. Specifically, examine time spent on client calls, administrative tasks, and digital screen time outside of work. Return any patterns with quantified impact.
AI
Analysis reveals a consistent pattern: clients recorded an average 18% lower subjective recovery score (e.g., a drop from 7.5 to 6.1) on days immediately following periods where cumulative client call duration exceeded 45 minutes. This correlation was stronger than for administrative tasks (7% decrease) or general screen time (4% decrease).-18% avg. recovery
Calls > 45min impact
-7% avg. recovery
Admin tasks impact
-4% avg. recovery
Screen time impact
From Hazy Notions to Targeted Recovery
A practitioner refines client recovery plans using AI to spot overlooked energy drains.
A nutritionist running a small EU practice, focused on athletic recovery.
Tools used
The real tools used here — swap any for your own equivalent. Each links to how we’d set it up.
Starting state
Before anything was set up
This nutritionist had a solid understanding of recovery principles but struggled to pinpoint subtle, non-training related stressors for individual clients. Weekly check-ins often yielded vague insights, leading to broad recommendations. Data from wearables and subjective logs existed, but the sheer volume made cross-referencing and pattern recognition a time-consuming, often neglected task. She knew there were deeper insights hidden in the data, but lacked the dedicated analytic capacity to find them.
| Client A (week 3) | low recovery score |
| Notes | 'Felt drained', 'long day of calls' |
| Training | low intensity |
| Client B (week 5) | low recovery score |
| Notes | 'Zoom exhaustion', 'desk work' |
Working state
Core Course, doing its job
Leveraging the Core Course's 'Ledger' module, she consolidated client subjective reports and activity logs from various apps into a unified Google Sheet. She then used Gemini to quickly scan for correlations between recovery metrics and daily activities, inputting a specific prompt designed to unearth non-obvious patterns. The AI's response immediately highlighted a surprising, quantifiable link.
Prompt
Analyze the provided anonymized client data from the last two months. Correlate subjective recovery scores (1-10 scale) with non-training daily activities. Look for statistically significant patterns where recovery scores drop following specific non-training events. Specifically, examine time spent on client calls, administrative tasks, and digital screen time outside of work. Return any patterns with quantified impact.
Analyze the provided anonymized client data from the last two months. Correlate subjective recovery scores (1-10 scale) with non-training daily activities. Look for statistically significant patterns where recovery scores drop following specific non-training events. Specifically, examine time spent on client calls, administrative tasks, and digital screen time outside of work. Return any patterns with quantified impact.
AI
Analysis reveals a consistent pattern: clients recorded an average 18% lower subjective recovery score (e.g., a drop from 7.5 to 6.1) on days immediately following periods where cumulative client call duration exceeded 45 minutes. This correlation was stronger than for administrative tasks (7% decrease) or general screen time (4% decrease).Use case implemented
The finished system, running on its own
Now, each Sunday, this nutritionist feeds the week's anonymized client data into her established Gemini prompt. Within minutes, she receives a concise summary of potential non-training stressors impacting recovery, complete with specific percentages and activity types. This efficiency allows her to proactively fine-tune client schedules, such as suggesting shorter client call blocks or advising active recovery on heavy administrative days, leading to better-tailored recovery protocols.
-18% avg. recovery
Calls > 45min impact
-7% avg. recovery
Admin tasks impact
-4% avg. recovery
Screen time impact
What an outside observer would notice
reduced by 80%
Time spent identifying stressors
up 12% in 6 weeks
Client-reported recovery improvements
The stack — build it yourself
Ubiquitous, flexible for custom data structures, and easy to export for AI analysis.
Excels at nuanced linguistic pattern matching and quantitative correlation across disparate data points.
These are the tools used in this story. Any can be swapped for an equivalent you already trust.
Go deeper
Do this yourself
Explore the 3-Layer Method
This story runs on Core Course. The tools and prompts above are the real build — swap any tool for your own equivalent and follow the same steps.