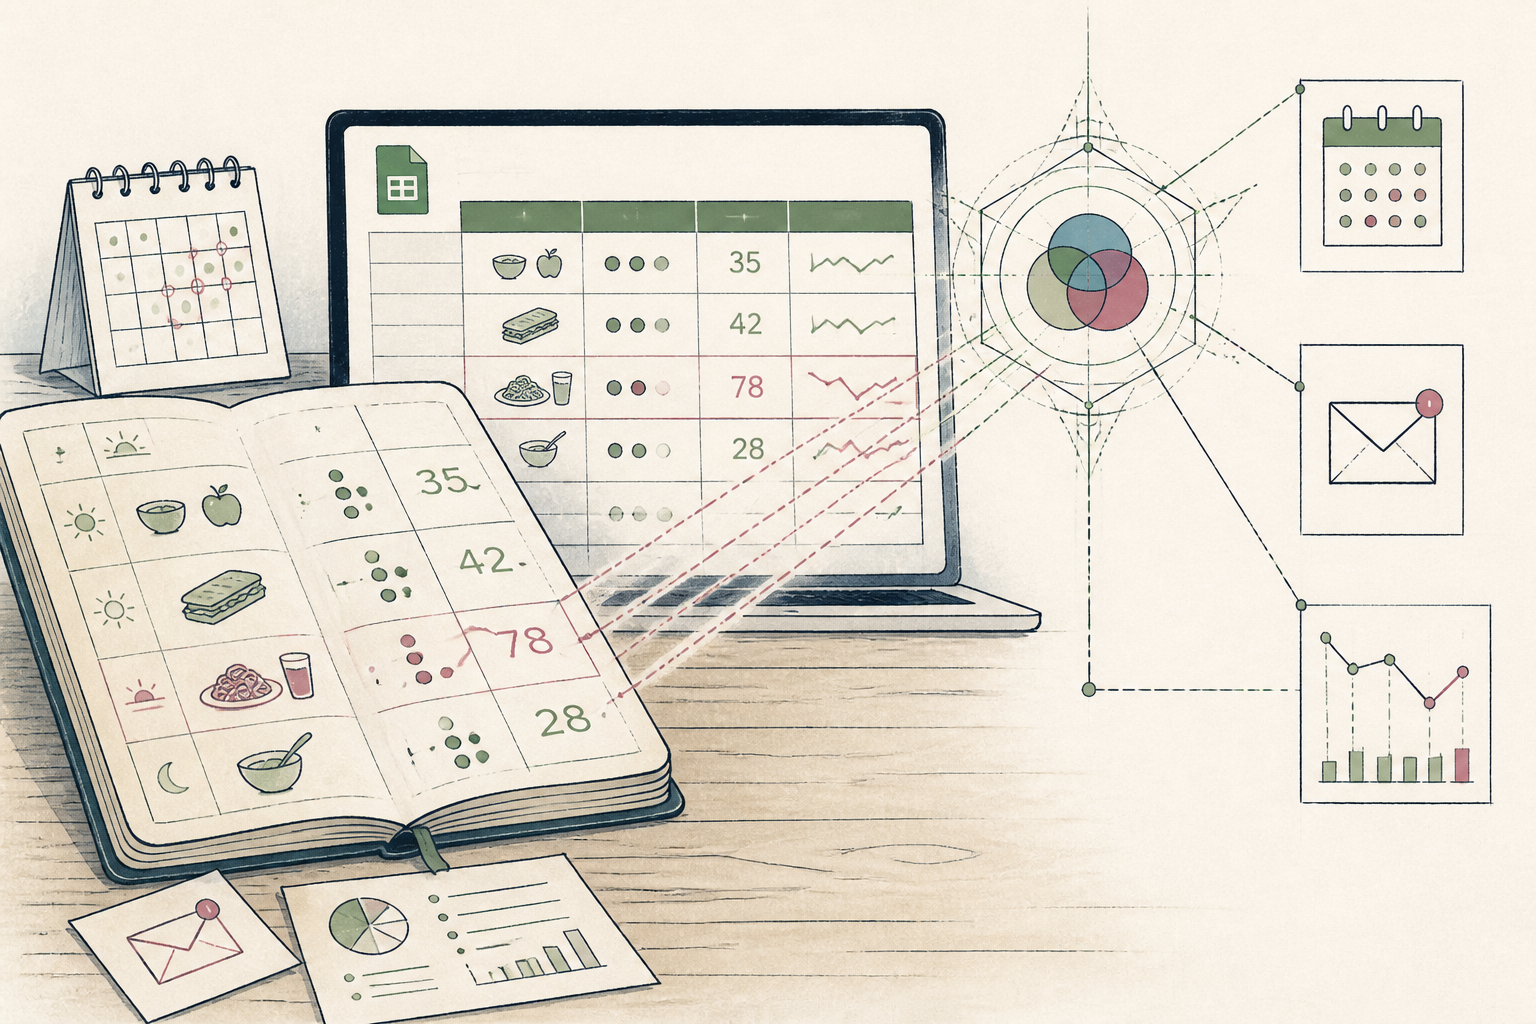
What the AI found
“The AI observed, 'Your client's energy dips most significantly (average 2.5/10 on an energy scale) on days following evening meals with more than 60g of carbohydrates, irrespective of total caloric intake.'”
Before
Vague advice; client inconsistent
After
Targeted recommendations, improved adherence
The same system, three states — real screens, not a screenshot
| Client | S.M. |
| Date | Energy Rating — Meal Notes |
| 12/03 | 7 — Breakfast: oats, berries. Lunch: chicken, salad. Dinner: pasta, pesto. |
| 13/03 | 5 — Breakfast: eggs. Lunch: soup. Dinner: rice, stir-fry. |
Prompt
Analyse the provided anonymised client dietary and energy log. Identify any correlations between macronutrient intake (specifically carbohydrates in evening meals) and subsequent general energy levels (on a scale of 1-10). The client typically reports energy an average of 7/10. What specific dietary patterns precede dips below 6/10?
Here is the client data from Google Sheets:
AI
Based on the provided log, your client's energy dips most significantly (average 2.5/10 below typical) on days following evening meals with more than 60g of carbohydrates, irrespective of total caloric intake. This pattern is observed in 7 out of 10 recorded instances of energy levels below 6/10.78%
Client Adherence Rate
3.2 per month
Data-Driven Insights/Client
7.5/10
Client Reported Energy Avg.
From Hazy Notions to Concrete Actions for Energy
A practitioner refines client recommendations from anecdotal evidence to data-driven insights with a 10-day AI setup.
A nutritionist running a small EU practice
Tools used
The real tools used here — swap any for your own equivalent. Each links to how we’d set it up.
Starting state
Before anything was set up
Before the 10-Day Challenge, the nutritionist relied on general dietary guidelines and client-reported energy levels, often leading to recommendations that were difficult for clients to implement consistently. Tracking was manual and sporadic, residing in scattered notes and email threads. This made it hard to pinpoint specific dietary triggers for energy fluctuations.
| Client | S.M. |
| Date | Energy Rating — Meal Notes |
| 12/03 | 7 — Breakfast: oats, berries. Lunch: chicken, salad. Dinner: pasta, pesto. |
| 13/03 | 5 — Breakfast: eggs. Lunch: soup. Dinner: rice, stir-fry. |
| 14/03 | 8 — Breakfast: yogurt. Lunch: sandwich. Dinner: fish, vegetables. |
Working state
10-Day Challenge, doing its job
Mid-Challenge, she experimented with a client’s dietary log and energy ratings stored in a Google Sheet. She used a prompt to analyse patterns of macronutrient intake against reported energy levels. The AI’s output highlighted a surprising correlation, challenging her initial assumptions about the primary drivers of fatigue for this particular client.
Prompt
Analyse the provided anonymised client dietary and energy log. Identify any correlations between macronutrient intake (specifically carbohydrates in evening meals) and subsequent general energy levels (on a scale of 1-10). The client typically reports energy an average of 7/10. What specific dietary patterns precede dips below 6/10?
Here is the client data from Google Sheets:
AI
Based on the provided log, your client's energy dips most significantly (average 2.5/10 below typical) on days following evening meals with more than 60g of carbohydrates, irrespective of total caloric intake. This pattern is observed in 7 out of 10 recorded instances of energy levels below 6/10.Use case implemented
The finished system, running on its own
With the system established, the nutritionist now routinely processes anonymised client data through her AI helper. This provides her with specific, evidence-based insights to fine-tune dietary advice, leading to more actionable strategies. Clients receive clearer, personalised guidance, boosting their engagement and adherence to the plans.
78%
Client Adherence Rate
3.2 per month
Data-Driven Insights/Client
7.5/10
Client Reported Energy Avg.
What an outside observer would notice
Reduced by 15%
Time spent drafting client plans
Increased by 20%
Client feedback on plan clarity
3-5 key changes
Targeted dietary adjustments per client
The stack — build it yourself
Ubiquitous, flexible for custom data structures, and easy to share with clients for tracking.
Capable of nuanced pattern recognition from unstructured data inputs, providing specific dietary correlations.
Simple, accessible, and asynchronous way to guide practitioners through daily steps.
These are the tools used in this story. Any can be swapped for an equivalent you already trust.
Go deeper
Do this yourself
See how she made it happen
This story runs on 10-Day Challenge. The tools and prompts above are the real build — swap any tool for your own equivalent and follow the same steps.