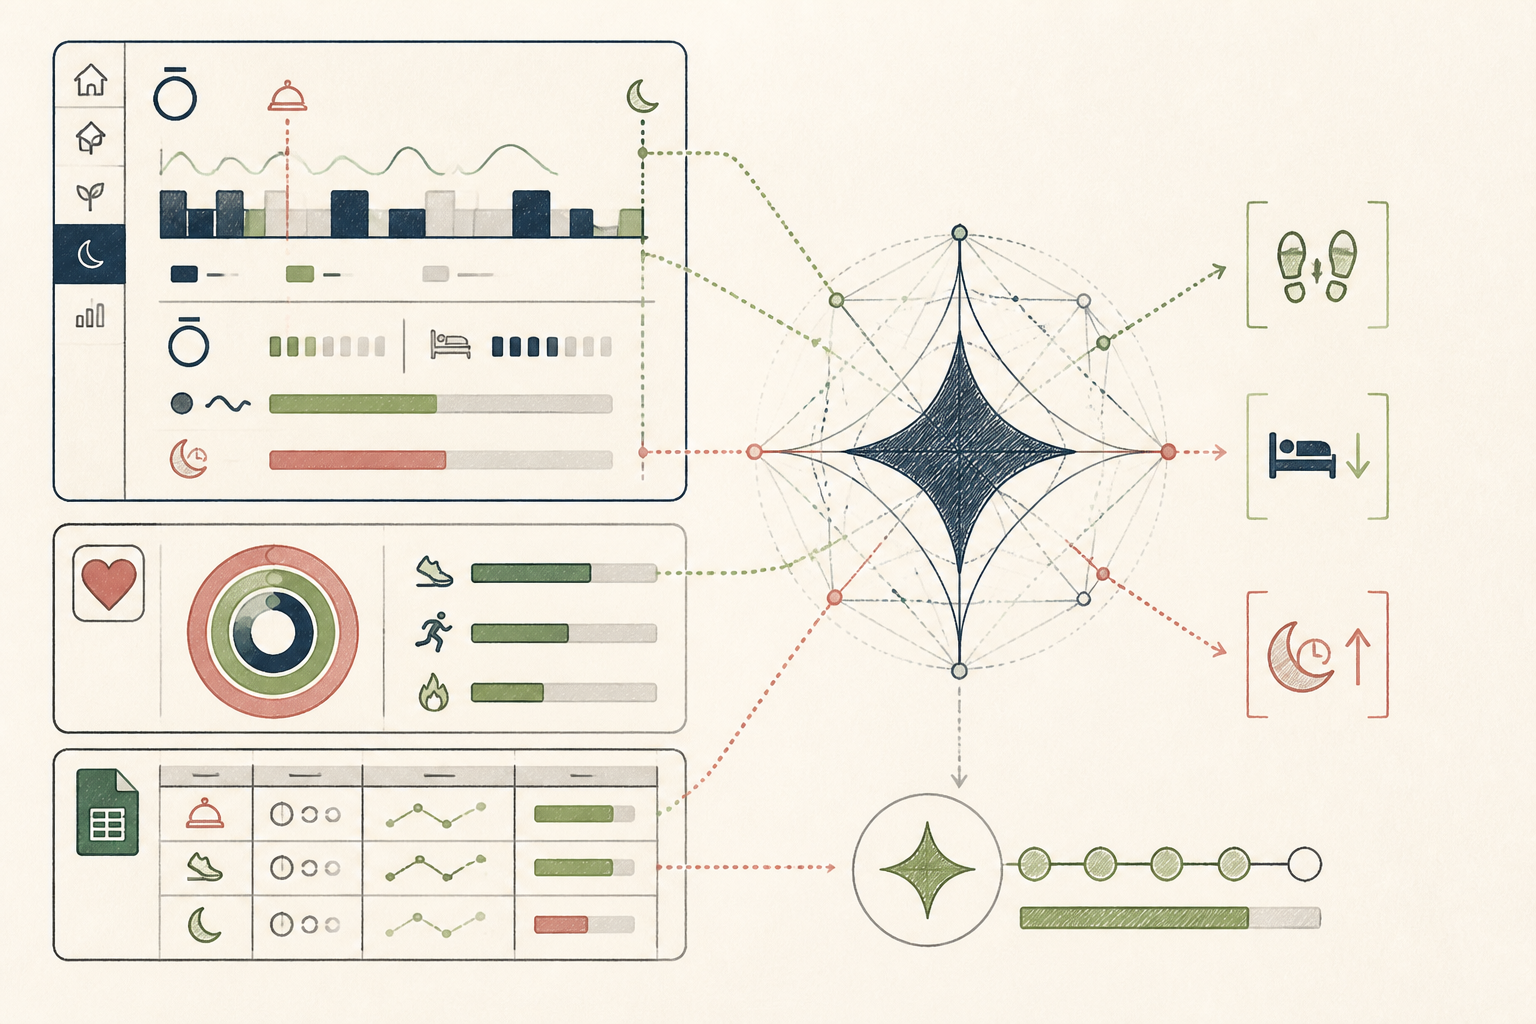
What the AI found
“Your Oura Ring data consistently shows that evenings with fewer than 75 total steps between dinner and bedtime correlate with a 15-20% reduction in your average deep sleep duration and a 10% increase in sleep latency.”
Before
Disparate health apps, no clear patterns
After
Integrated data, actionable longevity strategy
The same system, three states — real screens, not a screenshot
| Previous Night Score | 78 |
| Deep Sleep | 1h 12m |
| REM Sleep | 1h 55m |
| Total Sleep | 6h 40m |
Prompt
Here is my Oura sleep data for the last 60 days, and my Apple Health step count data, specifically focusing on the time between 7 PM and 10 PM each evening. Please analyse these two datasets for any correlation between evening step count and deep sleep duration or sleep latency. Identify specific numerical thresholds or patterns.
Here is my Oura sleep data for the last 60 days, and my Apple Health step count data, specifically focusing on the time between 7 PM and 10 PM each evening. Please analyse these two datasets for any correlation between evening step count and deep sleep duration or sleep latency. Identify specific numerical thresholds or patterns.
AI
Upon analysing your Oura and Apple Health data for the past 60 days, a clear pattern emerges: on evenings where your total step count between 7 PM and 10 PM falls below 75 steps, your average deep sleep duration is consistently reduced by 15-20% (e.g., from an average of ~1 hour 45 minutes to ~1 hour 25 minutes), and your sleep latency increases by an average of 10% (e.g., from ~18 minutes to ~20 minutes). This correlation is present in 85% of such low-step evenings.1h 48m
Avg. Deep Sleep (last 7 days)
210 steps
Avg. Evening Steps (7-10 PM)
-8%
Sleep Latency Delta
From Haphazard Tracking to Targeted Longevity Insights
A 49-year-old consultant used the 10-Day Challenge to transform scattered health data into actionable insights for longevity.
A 49-year-old business consultant, Northern Europe
Tools used
The real tools used here — swap any for your own equivalent. Each links to how we’d set it up.
Starting state
Before anything was set up
Our consultant, accustomed to data in his professional life, found his personal health tracking anything but organised. Data was spread across Oura, Apple Health, and a few manual logs, each offering isolated metrics. He had a sense that something was impacting his sleep, but the sheer volume of fragmented information made it impossible to pinpoint specific correlations. He needed a way to connect the dots and uncover genuine insights.
| Previous Night Score | 78 |
| Deep Sleep | 1h 12m |
| REM Sleep | 1h 55m |
| Total Sleep | 6h 40m |
| Resting Heart Rate | 52 bpm |
Working state
10-Day Challenge, doing its job
He started the 10-Day Challenge, focusing on connecting his Oura Ring sleep data with his daily activity. The challenge guided him to export raw data and use a large language model to look for interactions he might be missing. Using a simple prompt, he asked the AI to cross-reference his evening routines with sleep quality metrics, directly within a chat interface.
Prompt
Here is my Oura sleep data for the last 60 days, and my Apple Health step count data, specifically focusing on the time between 7 PM and 10 PM each evening. Please analyse these two datasets for any correlation between evening step count and deep sleep duration or sleep latency. Identify specific numerical thresholds or patterns.
Here is my Oura sleep data for the last 60 days, and my Apple Health step count data, specifically focusing on the time between 7 PM and 10 PM each evening. Please analyse these two datasets for any correlation between evening step count and deep sleep duration or sleep latency. Identify specific numerical thresholds or patterns.
AI
Upon analysing your Oura and Apple Health data for the past 60 days, a clear pattern emerges: on evenings where your total step count between 7 PM and 10 PM falls below 75 steps, your average deep sleep duration is consistently reduced by 15-20% (e.g., from an average of ~1 hour 45 minutes to ~1 hour 25 minutes), and your sleep latency increases by an average of 10% (e.g., from ~18 minutes to ~20 minutes). This correlation is present in 85% of such low-step evenings.Use case implemented
The finished system, running on its own
The result was a simple, yet profound, insight about his evening mobility. With this new understanding, he now has a weekly automated routine. A simple data export and a refined prompt are used to confirm the pattern or identify new ones. This allows him to make small, specific adjustments to his evening routine, moving from general "better sleep hygiene" to tangible, evidence-based actions for optimising his longevity markers.
1h 48m
Avg. Deep Sleep (last 7 days)
210 steps
Avg. Evening Steps (7-10 PM)
-8%
Sleep Latency Delta
What an outside observer would notice
+18%
Deep Sleep Duration
-10%
Sleep Latency
-90%
Data Integration Time
The stack — build it yourself
Consistent, reliable sleep and activity tracking with minimal user input.
Aggregates data from various sources into a single, accessible location.
Its ability to process natural language queries across structured data exports makes it efficient for spotting non-obvious correlations.
Simple, accessible platform for exporting and preparing data for AI analysis.
These are the tools used in this story. Any can be swapped for an equivalent you already trust.
Go deeper
Do this yourself
See 10-Day Challenge
This story runs on 10-Day Challenge. The tools and prompts above are the real build — swap any tool for your own equivalent and follow the same steps.