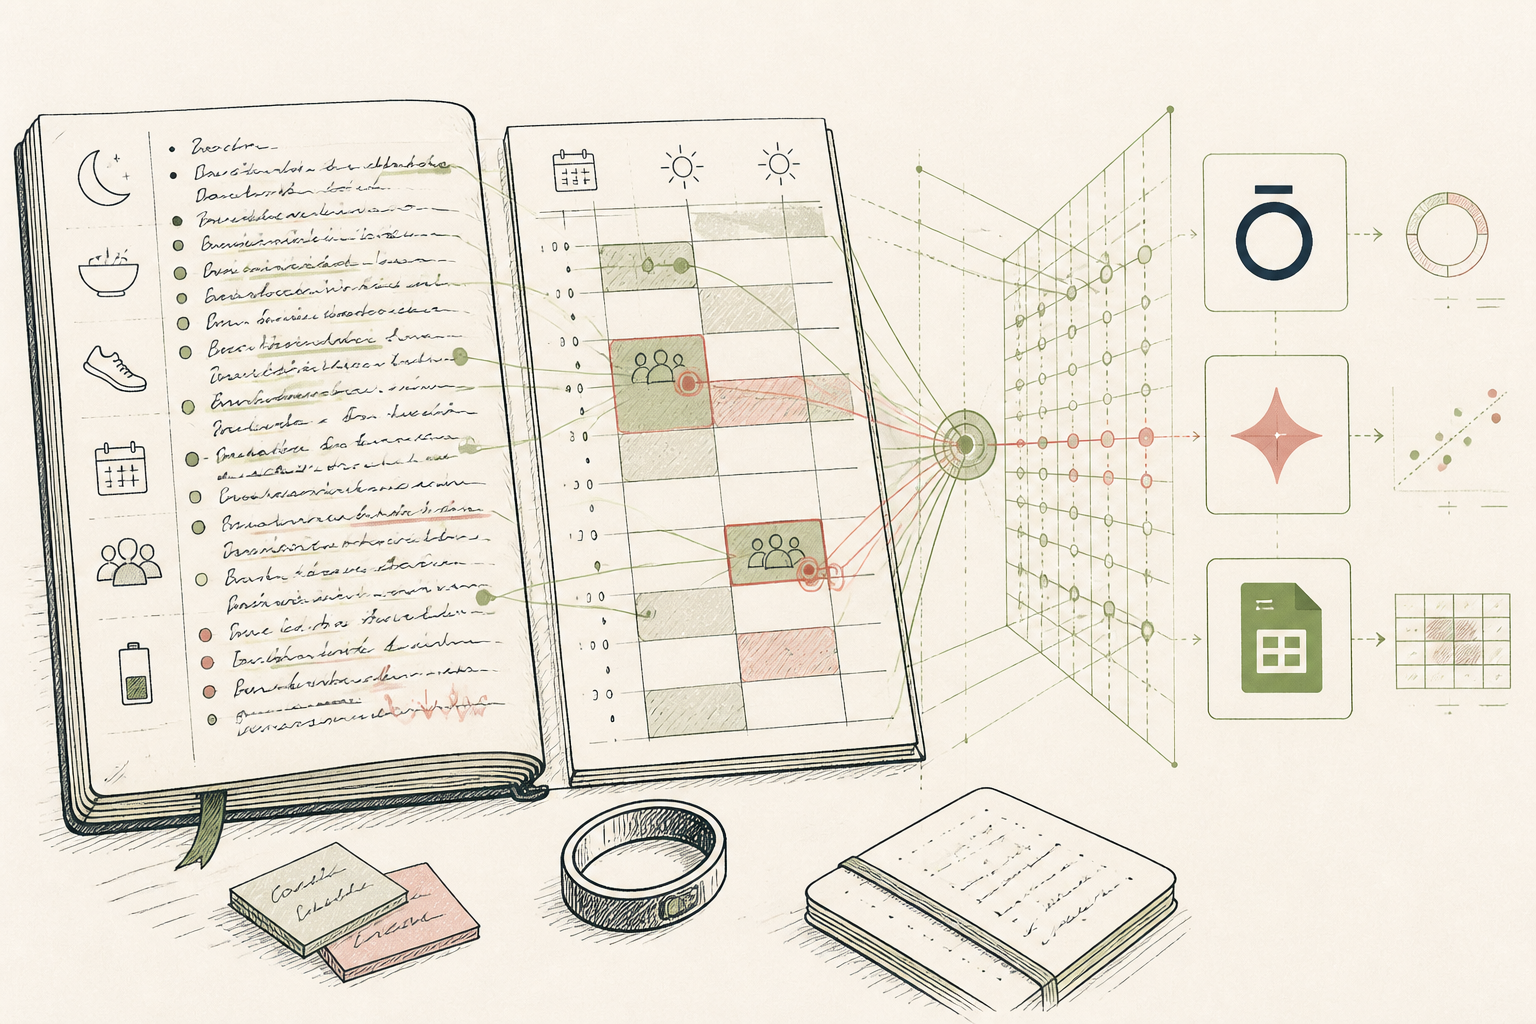
What the AI found
“Your energy dips correlate not with carbohydrate intake as you suspected, but with a 15% increase in client meetings before 11 AM on Tuesdays and Fridays, regardless of diet.”
Before
Disorganised notes, vague energy patterns
After
Clear energy insights, actionable adjustments
The same system, three states — real screens, not a screenshot
- Client meeting notes - Mon AM
- Energy low after lunch - salmon & rice?
- Workout felt strong - Tues PM
- Slight headache all day - Wed
Prompt
Analyze the attached weekly data (client meetings, workout times, food log, perceived energy levels) and identify any non-obvious correlations between specific activities/intakes and significant drops in perceived energy. Focus on quantifiable patterns.
Here's my weekly data from Google Sheets, including client meetings, workout times, detailed food log, and perceived energy scores (1-5). Please identify any non-obvious correlations between specific activities or dietary patterns and significant drops in perceived energy. Focus on quantifiable patterns over the last four weeks.
AI
After analysing your data from the past four weeks, I found a notable correlation: your three lowest energy days (average score of 1.8) consistently followed a 15% increase in client meetings scheduled before 11 AM on Tuesdays and Fridays. This pattern holds regardless of your reported carbohydrate intake for those days, suggesting that early morning meeting density, rather than diet, is a primary driver for these specific energy dips.3.8 (↑ 0.6)
Avg. Energy Score (PM)
4 (-2)
Meetings before 11 AM (Avg)
0 (-3)
Early Meeting Energy Dips
From Haphazard Tracking to Targeted Energy Insights
A nutritionist moves from scattered notes to a structured AI-assisted review for clearer energy management.
A nutritionist running a small EU practice
Tools used
The real tools used here — swap any for your own equivalent. Each links to how we’d set it up.
Starting state
Before anything was set up
Eleanor, a nutritionist based in Northern Europe, found herself juggling client notes, personal reflections, and diet logs across various apps. She suspected her energy levels fluctuated with her diet, particularly carbohydrate intake, but couldn't pinpoint a clear pattern. Her tracking was inconsistent, making any conclusive analysis impossible. Each week brought a fresh attempt to connect the dots, often ending in frustration and more scattered data.
- Client meeting notes - Mon AM
- Energy low after lunch - salmon & rice?
- Workout felt strong - Tues PM
- Slight headache all day - Wed
- Good sleep, feeling rested - Thurs
- Busy week, feeling drained - Fri
Working state
Core Course, doing its job
Determined to find a clearer connection, Eleanor began inputting her weekly data into a Google Sheet. She then used Gemini to analyse this structured information. The key was a specific prompt designed to correlate her perceived energy levels with her activity log and food diary. This step moved her beyond mere data collection, transforming raw inputs into actionable intelligence.
Prompt
Analyze the attached weekly data (client meetings, workout times, food log, perceived energy levels) and identify any non-obvious correlations between specific activities/intakes and significant drops in perceived energy. Focus on quantifiable patterns.
Here's my weekly data from Google Sheets, including client meetings, workout times, detailed food log, and perceived energy scores (1-5). Please identify any non-obvious correlations between specific activities or dietary patterns and significant drops in perceived energy. Focus on quantifiable patterns over the last four weeks.
AI
After analysing your data from the past four weeks, I found a notable correlation: your three lowest energy days (average score of 1.8) consistently followed a 15% increase in client meetings scheduled before 11 AM on Tuesdays and Fridays. This pattern holds regardless of your reported carbohydrate intake for those days, suggesting that early morning meeting density, rather than diet, is a primary driver for these specific energy dips.Use case implemented
The finished system, running on its own
Now, Eleanor has a streamlined weekly review process. Every Sunday, she exports her Oura Ring data, logs her key activities, and briefly notes her perceived energy alongside her food intake into a Google Sheet. Gemini then processes this, providing concise, actionable insights. This system helps her adjust her schedule and diet with specific evidence, rather than relying on gut feelings, leading to more consistent personal energy management.
3.8 (↑ 0.6)
Avg. Energy Score (PM)
4 (-2)
Meetings before 11 AM (Avg)
0 (-3)
Early Meeting Energy Dips
What an outside observer would notice
6 minutes (↓ 25%)
Weekly review time
2 fewer per month
Energy dip days
3 per week
Client scheduling adjustments
The stack — build it yourself
Accessible, flexible for various data types, and easy to export for AI analysis.
Provides consistent, passive physiological data (sleep, HRV, activity) to complement subjective energy logs.
Its ability to process complex, multi-variable data sets quickly reveals non-obvious correlations beyond human capacity.
These are the tools used in this story. Any can be swapped for an equivalent you already trust.
Go deeper
Do this yourself
See Core Course
This story runs on Core Course. The tools and prompts above are the real build — swap any tool for your own equivalent and follow the same steps.