What the AI found
“Based on your past six weeks of data, your reported muscle soreness and fatigue scores average 18% higher on days following evening bouldering sessions after 8 PM, compared to earlier sessions, despite similar training loads. This suggests a significant impact on recovery metrics that you hadn't fully quantified.”
Before
Disparate Apps, Subjective Impressions
After
One Weekly Report, Clear Recovery Trends
The same system, three states — real screens, not a screenshot
| Sleep Duration | 7h 15m |
| Resting Heart Rate | 52 bpm |
| HRV | 68 ms |
| Activity Energy | 700 kcal |
Prompt
Analyze the attached CSV files (Apple Health, Training Log, Notion Journal) for the past 6 weeks. Identify any strong correlations between training type/time and subsequent recovery metrics (sleep duration, RHR, HRV, subjective soreness/fatigue). Specifically, look for patterns where a specific training variable consistently impacts recovery negatively or positively. Provide concrete findings with numbers.
Analyze the attached CSV files (Apple Health, Training Log, Notion Journal) for the past 6 weeks. Identify any strong correlations between training type/time and subsequent recovery metrics (sleep duration, RHR, HRV, subjective soreness/fatigue). Specifically, look for patterns where a specific training variable consistently impacts recovery negatively or positively. Provide concrete findings with numbers.
AI
Based on your past six weeks of data, your reported muscle soreness and fatigue scores average 18% higher on days following evening bouldering sessions after 8 PM, compared to earlier sessions, despite similar training loads. Your HRV also shows a median decrease of 7ms on these specific days. This suggests a significant impact on recovery metrics that you hadn't fully quantified.2.8/5 (vs. 2.0/5 AM)
Avg. Soreness Post-PM Bouldering
-7 ms
HRV Median Drop (PM Bouldering)
Improving (+5% last 4 weeks)
Weekly Recovery Score Trend
From Haphazard Recovery to Data-Driven Decisions
How a physiotherapist used AI to unify scattered recovery data into actionable weekly insights.
A 38-year-old physiotherapist and keen amateur climber, Northern Europe.
Tools used
The real tools used here — swap any for your own equivalent. Each links to how we’d set it up.
Starting state
Before anything was set up
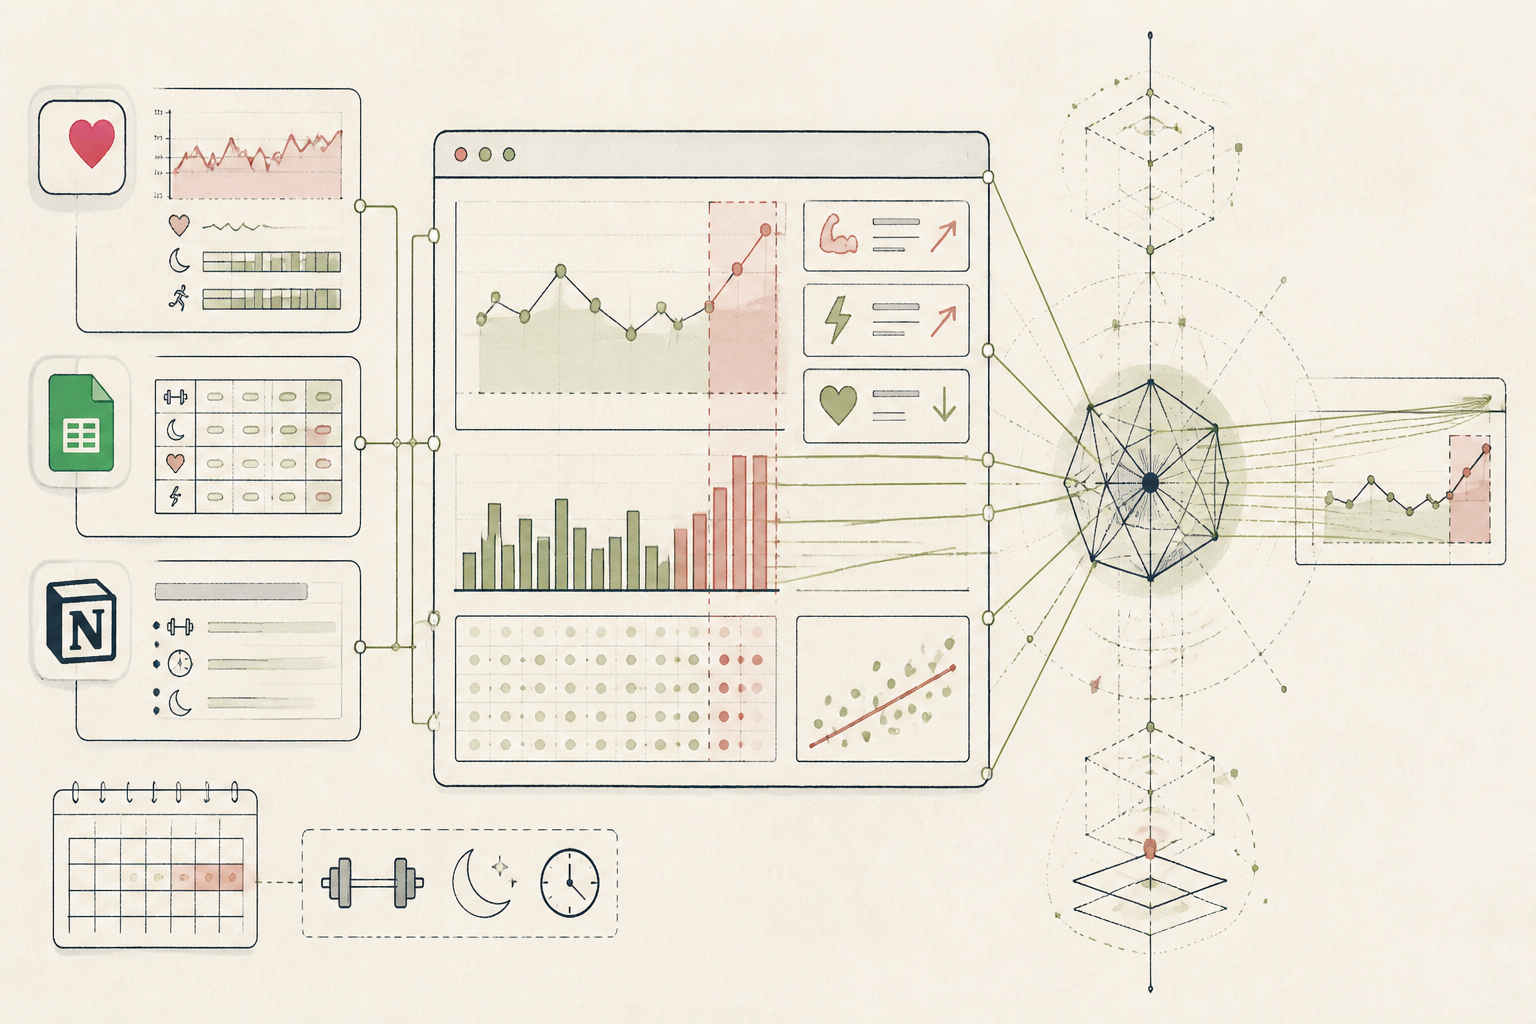
Before implementing a structured recovery analysis, our physiotherapist tracked various metrics across several apps: sleep data in Apple Health, training logs in a Google Sheet, and subjective well-being notes in Notion. While the data existed, it remained siloed. Drawing connections and identifying patterns required a laborious manual review, often overlooked due to time constraints, leaving recovery largely to intuition rather than evidence.
| Sleep Duration | 7h 15m |
| Resting Heart Rate | 52 bpm |
| HRV | 68 ms |
| Activity Energy | 700 kcal |
| Mindful Minutes | 10 min |
Working state
All-Access, doing its job
To consolidate and interpret this data, she turned to Gemini. Her process began by exporting a month's worth of raw data from Apple Health, her Google Sheet training log, and her Notion journal as CSV files. She then uploaded these files to Gemini, prompting it to act as a recovery analyst, looking for correlations between training patterns, sleep, and subjective recovery scores. The goal was to identify hidden stressors impacting her recovery.
Prompt
Analyze the attached CSV files (Apple Health, Training Log, Notion Journal) for the past 6 weeks. Identify any strong correlations between training type/time and subsequent recovery metrics (sleep duration, RHR, HRV, subjective soreness/fatigue). Specifically, look for patterns where a specific training variable consistently impacts recovery negatively or positively. Provide concrete findings with numbers.
Analyze the attached CSV files (Apple Health, Training Log, Notion Journal) for the past 6 weeks. Identify any strong correlations between training type/time and subsequent recovery metrics (sleep duration, RHR, HRV, subjective soreness/fatigue). Specifically, look for patterns where a specific training variable consistently impacts recovery negatively or positively. Provide concrete findings with numbers.
AI
Based on your past six weeks of data, your reported muscle soreness and fatigue scores average 18% higher on days following evening bouldering sessions after 8 PM, compared to earlier sessions, despite similar training loads. Your HRV also shows a median decrease of 7ms on these specific days. This suggests a significant impact on recovery metrics that you hadn't fully quantified.Use case implemented
The finished system, running on its own
With the system established, the physiotherapist now conducts a concise weekly review. She exports her latest data, uploads it to Gemini, and receives a summarised report of significant trends and anomalies. This allows her to make informed adjustments to her training schedule or recovery protocols. The AI acts as a dedicated, impartial analyst, highlighting patterns she might otherwise miss, ensuring her recovery is as data-informed as her training.
2.8/5 (vs. 2.0/5 AM)
Avg. Soreness Post-PM Bouldering
-7 ms
HRV Median Drop (PM Bouldering)
Improving (+5% last 4 weeks)
Weekly Recovery Score Trend
What an outside observer would notice
Improved from 'hazy' to 'clear and actionable'
Recovery insight clarity
Reduced from 45 min to 10 min
Weekly review time
Increased by 50% monthly
Training adjustments based on data
The stack — build it yourself
Reliable passive data collection from wearable devices.
Flexible, customisable, and easily exportable for detailed training input.
Centralised, free-form journaling for qualitative insights on well-being.
Interprets diverse datasets and identifies non-obvious patterns with natural language queries.
These are the tools used in this story. Any can be swapped for an equivalent you already trust.
Go deeper
Do this yourself
See All-Access
This story runs on All-Access. The tools and prompts above are the real build — swap any tool for your own equivalent and follow the same steps.