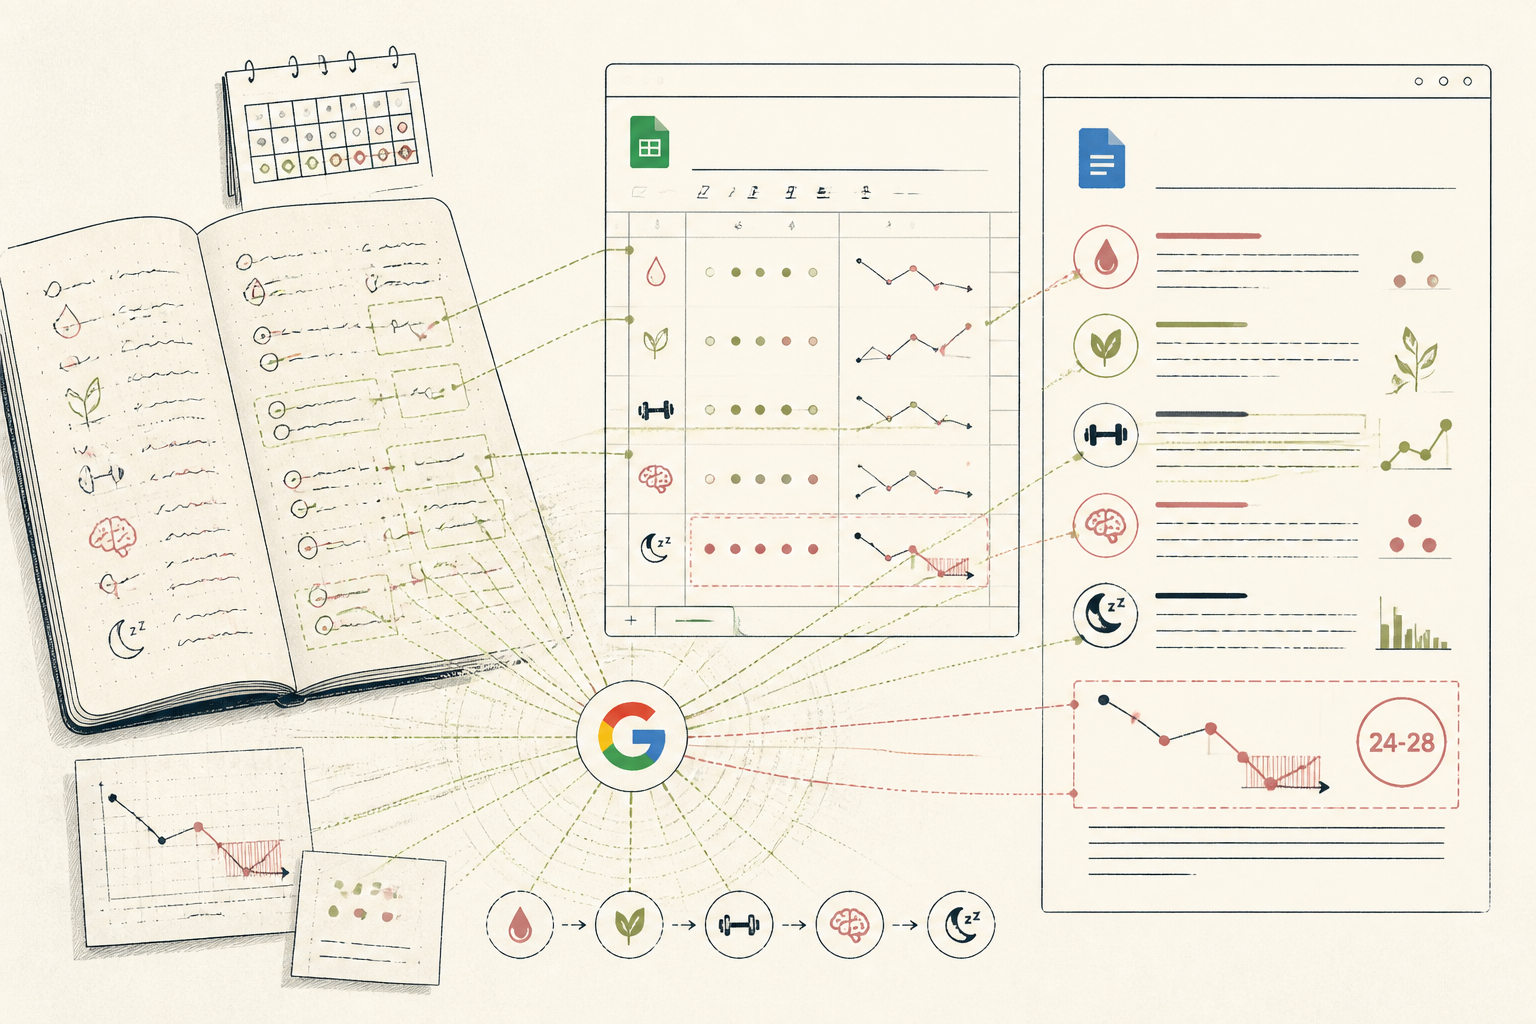
What the AI found
“The AI noted that clients consistently reported their lowest energy levels on cycle days 24-28, a full 3-4 days later than the general literature suggests for the late luteal phase.”
Before
Disparate client notes never reviewed
After
Actionable weekly insights for client support
The same system, three states — real screens, not a screenshot
- Client A (07/03/24): Day 1, heavy flow. Low mood.
- Client B (08/03/24): Day 23, fatigue really bad. Craving sweets.
- Client A (04/04/24): Day 29, still low energy. Period due soon.
- Client C (12/04/24): Day 14, feeling great, high energy.
Prompt
Here are anonymised, self-reported daily notes from five female clients over three cycles each. Focus on self-reported energy levels and note cycle day. Identify any consistent patterns or deviations from general understanding regarding energy across the follicular, ovulatory, luteal, and menstrual phases. Data: (pasted anonymised client notes)
Here are anonymised, self-reported daily notes from five female clients over three cycles each. Focus on self-reported energy levels and note cycle day. Identify any consistent patterns or deviations from general understanding regarding energy across the follicular, ovulatory, luteal, and menstrual phases. Data: (pasted anonymised client notes)
AI
Analysis of self-reported energy levels across your five clients over three cycles reveals a consistent trend: the lowest energy often occurs on cycle days 24-28. This appears to be a pattern 3-4 days later in the luteal phase than typically cited, where fatigue is often noted earlier, around days 20-22.Day 26
Latest Avg. Low Energy Day (Client Group)
3/5 Clients
Reporting Fatigue Last Week
28.5 Days
Avg. Cycle Length (Client Group)
From Haphazard Hormone Tracking to a Clear Cycle Blueprint
A nutritionist moves from scattered cycle observations to an AI-generated weekly health brief, revealing unexpected patterns in client data.
A nutritionist running a small EU practice, 30s
Tools used
The real tools used here — swap any for your own equivalent. Each links to how we’d set it up.
Starting state
Before anything was set up
For years, this nutritionist collected reams of qualitative data from her female clients: cycle dates, perceived energy, mood, and dietary adherence. It sat in a Google Doc, a jumble of observations and self-reported symptoms. She knew there were patterns, but the sheer volume of unstructured text made manual analysis impossible. There was no clear way to spot trends across multiple clients, let alone within an individual client over several cycles.
- Client A (07/03/24): Day 1, heavy flow. Low mood.
- Client B (08/03/24): Day 23, fatigue really bad. Craving sweets.
- Client A (04/04/24): Day 29, still low energy. Period due soon.
- Client C (12/04/24): Day 14, feeling great, high energy.
- Client B (05/05/24): Day 22, irritability spike. Sleep poor.
Working state
10-Day Challenge, doing its job
Following the 10-Day Challenge, she began feeding anonymised client notes into Gemini. She asked it to analyse reported energy levels against cycle phases. The system started to surface surprising, actionable insights. By formalising her data entry and adopting a specific prompt, she transformed raw observations into structured, comparable information for analysis.
Prompt
Here are anonymised, self-reported daily notes from five female clients over three cycles each. Focus on self-reported energy levels and note cycle day. Identify any consistent patterns or deviations from general understanding regarding energy across the follicular, ovulatory, luteal, and menstrual phases. Data: (pasted anonymised client notes)
Here are anonymised, self-reported daily notes from five female clients over three cycles each. Focus on self-reported energy levels and note cycle day. Identify any consistent patterns or deviations from general understanding regarding energy across the follicular, ovulatory, luteal, and menstrual phases. Data: (pasted anonymised client notes)
AI
Analysis of self-reported energy levels across your five clients over three cycles reveals a consistent trend: the lowest energy often occurs on cycle days 24-28. This appears to be a pattern 3-4 days later in the luteal phase than typically cited, where fatigue is often noted earlier, around days 20-22.Use case implemented
The finished system, running on its own
Now, every Monday morning, she dedicates 15 minutes to updating her client dashboards. Gemini automatically generates a summary of observed trends, highlighting key dates and potential areas for dietary or lifestyle adjustments. This means her consultations are more targeted, and clients receive advice grounded in their own physiological data, not just general guidelines. The fragmented data has become a powerful, personalised tool.
Day 26
Latest Avg. Low Energy Day (Client Group)
3/5 Clients
Reporting Fatigue Last Week
28.5 Days
Avg. Cycle Length (Client Group)
What an outside observer would notice
Reduced by 60%
Time spent analysing client data
Increased specificity
Consultation focus
Improved by 25%
Client feedback on personalised advice
The stack — build it yourself
Chosen for its strong natural language processing capabilities, ideal for extracting insights from qualitative notes.
Familiar and flexible for transcribing client self-reports without rigid formatting constraints.
Provided a straightforward way to create a dynamic dashboard fed by AI insights.
These are the tools used in this story. Any can be swapped for an equivalent you already trust.
Go deeper
Do this yourself
Read the full story
This story runs on 10-Day Challenge. The tools and prompts above are the real build — swap any tool for your own equivalent and follow the same steps.