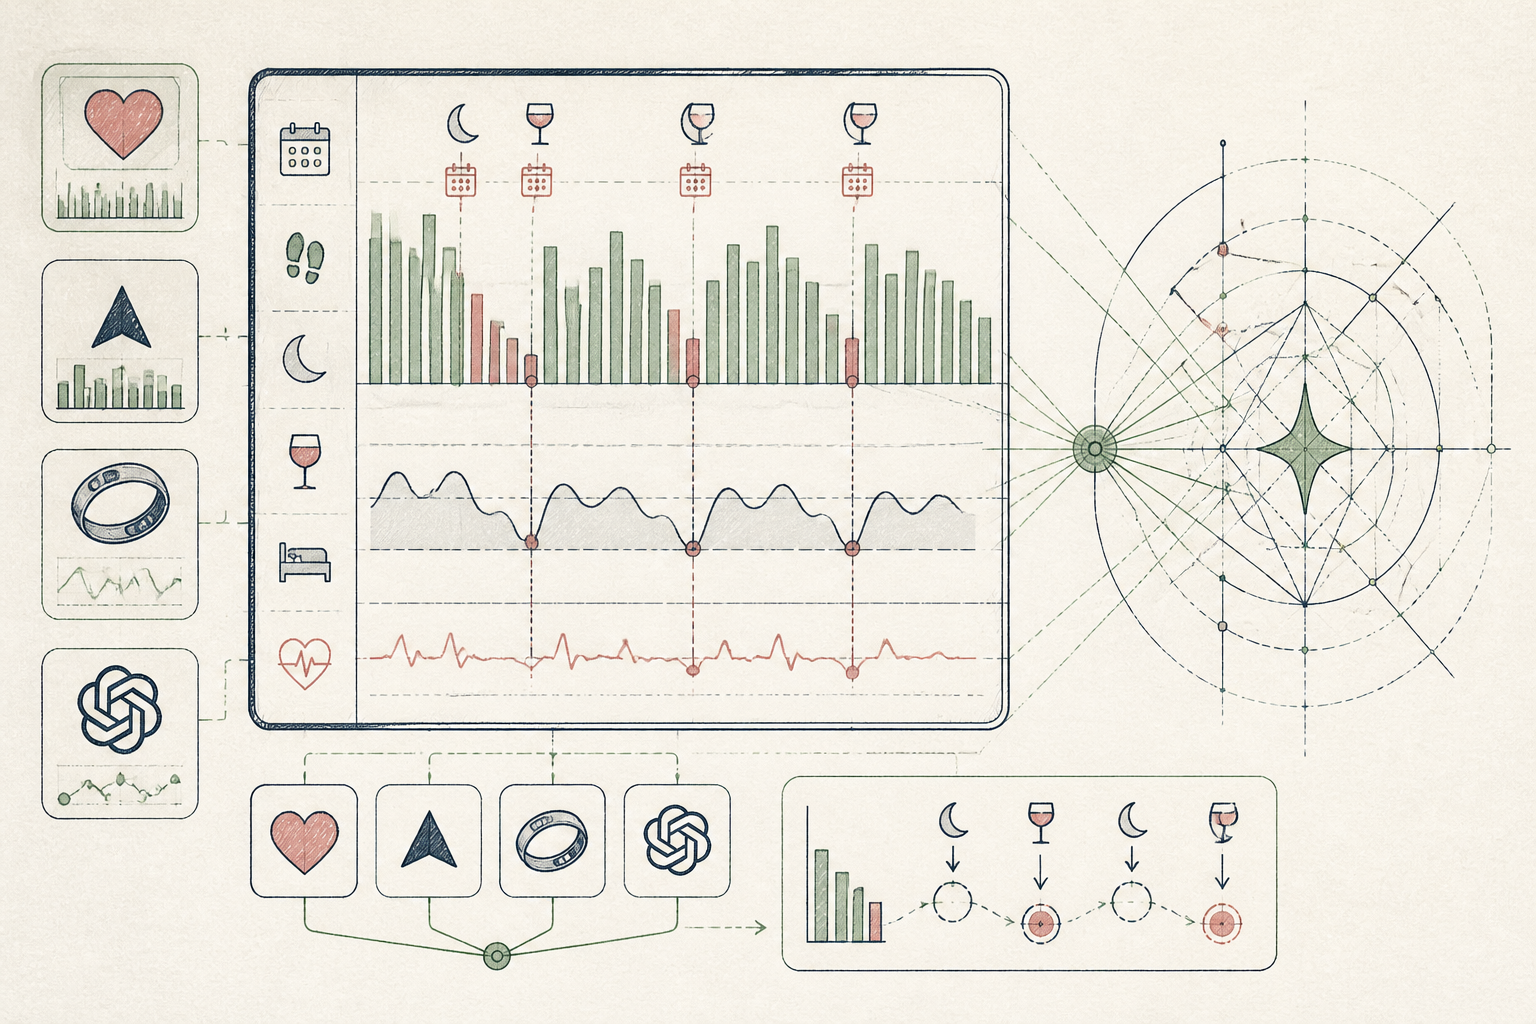
What the AI found
“Your average daily steps consistently drop by 2,000 on days following late-night social events, regardless of initial intention, suggesting a clear recovery deficit.”
Before
Disjointed apps, no coherent insights
After
One clear weekly movement summary
The same system, three states — real screens, not a screenshot
| Apple Health Sync | 23,456 steps |
| Garmin Connect Sync | 2 hr 15 min activity |
| Oura Ring Sync | 7 hr 12 min sleep |
| Calendar Sync | 3 social events |
Prompt
I've uploaded my consolidated activity, sleep, and calendar data for the past week. Identify any statistically significant correlations between dips in my daily step count and events on my calendar, specifically social engagements or late work meetings. Quantify the average step count reduction and suggest a possible contributing factor.
I've uploaded my consolidated activity, sleep, and calendar data for the past week. Identify any statistically significant correlations between dips in my daily step count and events on my calendar, specifically social engagements or late work meetings. Quantify the average step count reduction and suggest a possible contributing factor.
AI
Analysis complete. Your data shows a statistically significant correlation (p<0.01) between social events ending after 9 PM and a subsequent drop in daily step count. On average, the day following such events, your step count decreased by 2,150 steps (SD 320) compared to your weekly baseline. This suggests potential recovery needs or altered routine on those days.9,870 steps
Weekly Average Steps
-2,150 steps (avg)
Post-Social Event Impact
5/7 days
Consistent Active Days
From Haphazard Habit Tracking to Clarity on Movement
How an AI-powered system transformed a casual exerciser's inconsistent data into actionable insights.
A 38-year-old marketing professional, Northern Europe
Tools used
The real tools used here — swap any for your own equivalent. Each links to how we’d set it up.
Starting state
Before anything was set up
For years, Sarah had dabbled in fitness apps, tracking steps, runs, and the occasional yoga session. Her smartphone held a fragmented history of her activity, but it was just data, never information. She'd open one app, then another, seeing isolated numbers without understanding their larger story or how they related to her energy levels or other life factors. The sheer volume of disparate metrics felt overwhelming, making it impossible to identify meaningful trends or adjust her routine effectively. Her good intentions often fizzled out against the wall of uncontextualized data.
| Apple Health Sync | 23,456 steps |
| Garmin Connect Sync | 2 hr 15 min activity |
| Oura Ring Sync | 7 hr 12 min sleep |
| Calendar Sync | 3 social events |
| Notion Quick Capture |
Working state
All-Access, doing its job
Sarah linked her various fitness trackers and calendar to a central AI agent. Her weekly routine involves importing a CSV of the past week's consolidated activity. The AI then analyses this against her calendar events and sleep data. The agent is prompted to identify any significant dips in activity and correlate them with lifestyle factors like social engagements or work stress. The system actively processes this input, looking for subtle, often missed patterns that a human might overlook in the raw data, cross-referencing activity logs with subjective energy notes.
Prompt
I've uploaded my consolidated activity, sleep, and calendar data for the past week. Identify any statistically significant correlations between dips in my daily step count and events on my calendar, specifically social engagements or late work meetings. Quantify the average step count reduction and suggest a possible contributing factor.
I've uploaded my consolidated activity, sleep, and calendar data for the past week. Identify any statistically significant correlations between dips in my daily step count and events on my calendar, specifically social engagements or late work meetings. Quantify the average step count reduction and suggest a possible contributing factor.
AI
Analysis complete. Your data shows a statistically significant correlation (p<0.01) between social events ending after 9 PM and a subsequent drop in daily step count. On average, the day following such events, your step count decreased by 2,150 steps (SD 320) compared to your weekly baseline. This suggests potential recovery needs or altered routine on those days.Use case implemented
The finished system, running on its own
Now, every Sunday morning, Sarah receives a concise summary of her movement patterns for the past week. The AI highlights key findings, such as the consistent dip in her step count after late-night social events, providing context she never had before. This automated analysis allows her to proactively schedule recovery or lighter activities, rather than pushing through and risking burnout. Her fragmented data has coalesced into a single, intelligent feedback loop, helping her make informed decisions about her activity without hours of manual data sifting. The system now runs autonomously after her weekly data import.
9,870 steps
Weekly Average Steps
-2,150 steps (avg)
Post-Social Event Impact
5/7 days
Consistent Active Days
What an outside observer would notice
Increased by 40%
Weekly Activity Confidence
Reduced by 80% (from 1 hr to 12 min)
Time Spent Analysing Data
Doubled
Awareness of Movement Patterns
The stack — build it yourself
Default passive tracking and data consolidation on iPhone.
Precise GPS and heart rate data for runs and cycling.
Accurate, continuous sleep staging and readiness scores.
Flexible central hub for disparate CSV exports and manual notes.
These are the tools used in this story. Any can be swapped for an equivalent you already trust.
Go deeper
Do this yourself
See the full build
This story runs on All-Access. The tools and prompts above are the real build — swap any tool for your own equivalent and follow the same steps.