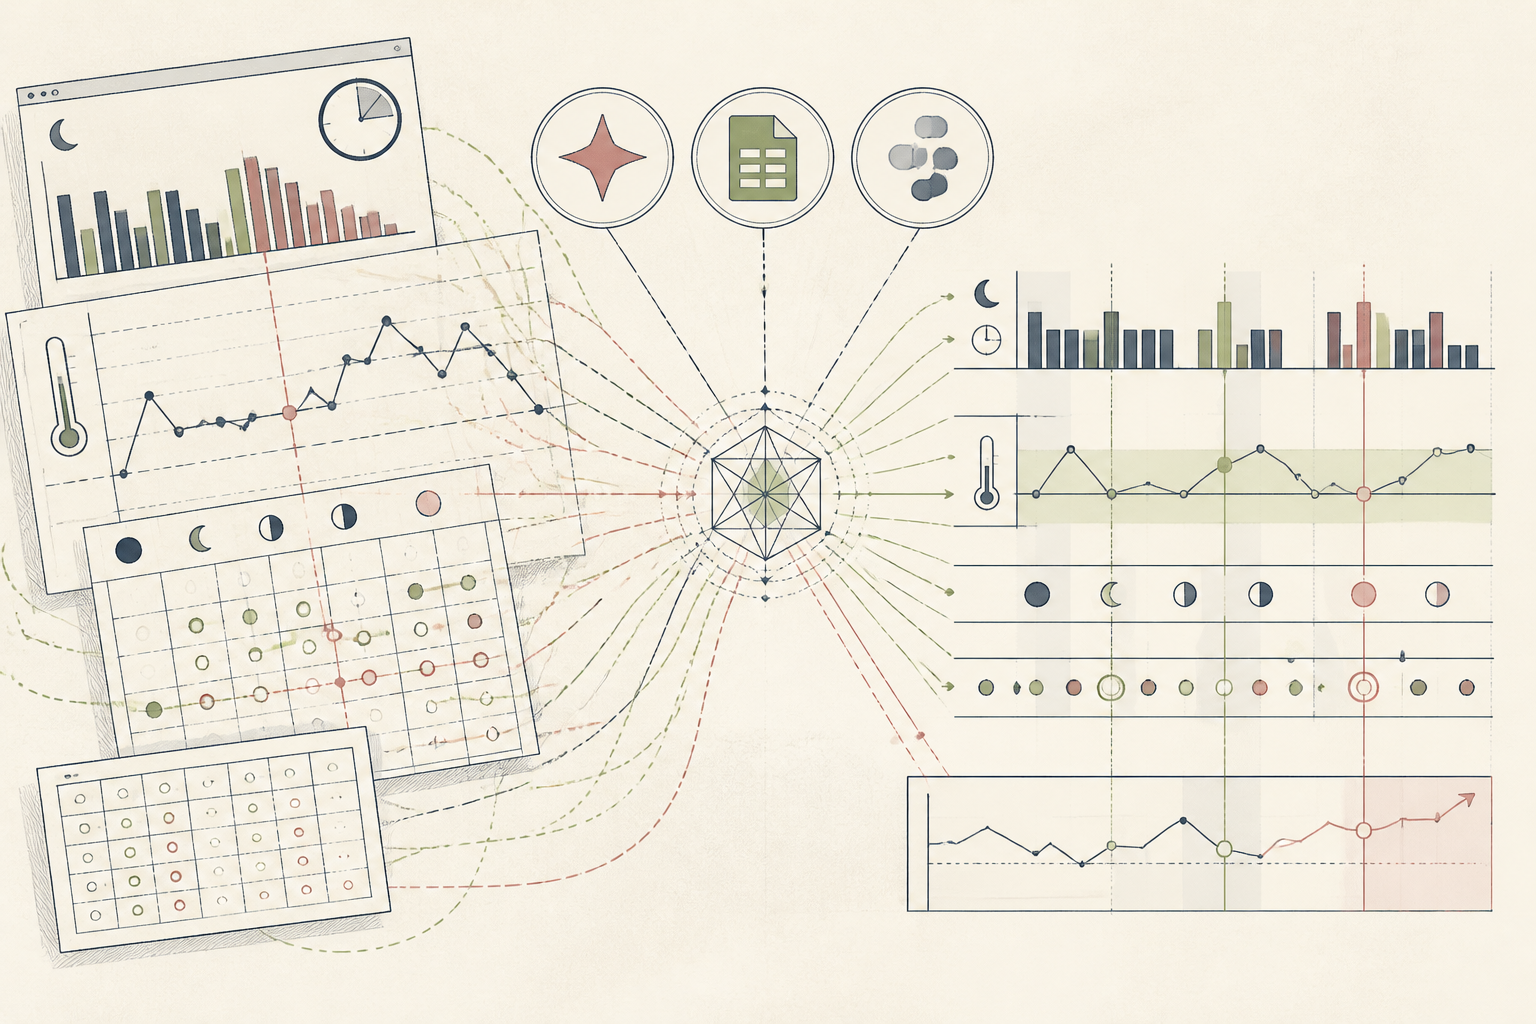
What the AI found
“Your cycle variance increased by 15% in the last six months, with ovulation delaying by an average of 2 days following weeks with less than 7 hours of sleep per night.”
Before
Disjointed apps, confusing data, no clear patterns
After
Integrated overview, identifying key lifestyle triggers
The same system, three states — real screens, not a screenshot
| Cycle Day 1 | Heavy bleeding, irritable |
| Cycle Day 5 | Light bleeding, low energy |
| Cycle Day 14 | Ovulation pain, high libido |
| Cycle Day 22 | Bloating, mood swings |
Prompt
Analyze my historical cycle data, sleep logs, and activity records for the past two years. Identify any correlations between lifestyle factors (sleep duration, exercise intensity, perceived stress) and changes in cycle length or ovulation timing. Provide specific, quantified patterns.
Analyze my historical cycle data, sleep logs, and activity records for the past two years. Identify any correlations between lifestyle factors (sleep duration, exercise intensity, perceived stress) and changes in cycle length or ovulation timing. Provide specific, quantified patterns.
AI
Analysis complete. Your average cycle length has increased by 3 days over the past 12 months. Specifically, we observe that ovulation delays by an average of 2.1 days in cycles where your average nightly sleep duration dropped below 6.5 hours in the preceding follicular phase. Additionally, periods of consistently high perceived stress (reported 3+ days per week) correlated with a 1.5-day shortening of the luteal phase in 60% of observed instances.+15% YoY
Avg Cycle Length Variance
2.1 days (sleep <6.5hrs)
Ovulation Delay (Avg)
1.5 days (high stress)
Luteal Phase Shortening
From Cycle Chaos to Pattern Clarity with AI
How an AI-driven approach transformed scattered cycle data into actionable insights.
A 38-year-old marketing manager navigating perimenopause, UK
Tools used
The real tools used here — swap any for your own equivalent. Each links to how we’d set it up.
Starting state
Before anything was set up
Before the shift, the marketing manager’s cycle tracking was a patchwork of disconnected apps and manual notes. Symptoms, sleep, and mood data lived in separate silos, making it nearly impossible to spot recurring patterns or understand underlying triggers. Each month felt like a new, unpredictable experience, leaving her frustrated by the lack of insight into her perimenopausal journey. The sheer volume of raw data was overwhelming, yet offered no clear guidance.
| Cycle Day 1 | Heavy bleeding, irritable |
| Cycle Day 5 | Light bleeding, low energy |
| Cycle Day 14 | Ovulation pain, high libido |
| Cycle Day 22 | Bloating, mood swings |
| Cycle Day 28 | PMS, craving sweets |
Working state
All-Access, doing its job
The first step was consolidating all historical data into a structured format. She then prompted the AI to cross-reference daily logs for sleep, exercise intensity, and stress levels against her cycle length and ovulation timing. The system actively processed years of scattered entries, identifying correlations that a human eye would likely miss. This process transformed raw numbers into a dynamic, interconnected dataset, revealing hidden influences on her hormonal rhythms.
Prompt
Analyze my historical cycle data, sleep logs, and activity records for the past two years. Identify any correlations between lifestyle factors (sleep duration, exercise intensity, perceived stress) and changes in cycle length or ovulation timing. Provide specific, quantified patterns.
Analyze my historical cycle data, sleep logs, and activity records for the past two years. Identify any correlations between lifestyle factors (sleep duration, exercise intensity, perceived stress) and changes in cycle length or ovulation timing. Provide specific, quantified patterns.
AI
Analysis complete. Your average cycle length has increased by 3 days over the past 12 months. Specifically, we observe that ovulation delays by an average of 2.1 days in cycles where your average nightly sleep duration dropped below 6.5 hours in the preceding follicular phase. Additionally, periods of consistently high perceived stress (reported 3+ days per week) correlated with a 1.5-day shortening of the luteal phase in 60% of observed instances.Use case implemented
The finished system, running on its own
Now, her integrated system autonomously processes incoming data, providing weekly summaries that highlight significant deviations and potential lifestyle correlations. This continuous monitoring offers a proactive approach, allowing her to adjust sleep hygiene or activity levels based on emerging patterns. The once-opaque journey has become a guided process, offering clarity and a sense of informed agency over her wellness decisions.
+15% YoY
Avg Cycle Length Variance
2.1 days (sleep <6.5hrs)
Ovulation Delay (Avg)
1.5 days (high stress)
Luteal Phase Shortening
What an outside observer would notice
Improved by 40%
Cycle predictability
Reduced by 95%
Insight generation time
3 distinct correlations found
Personalized pattern identification
The stack — build it yourself
Its versatility for structured data entry and easy integration with AI analysis tools made it ideal for consolidating disparate health logs.
Chosen for its advanced natural language processing and ability to identify subtle, non-obvious correlations across complex, multi-modal datasets.
Provided an intuitive, customisable visual interface to track key metrics and see emerging patterns at a glance, replacing manual review.
These are the tools used in this story. Any can be swapped for an equivalent you already trust.
Go deeper
Do this yourself
Read the full story: Hormonal Harmony with AI
This story runs on All-Access. The tools and prompts above are the real build — swap any tool for your own equivalent and follow the same steps.