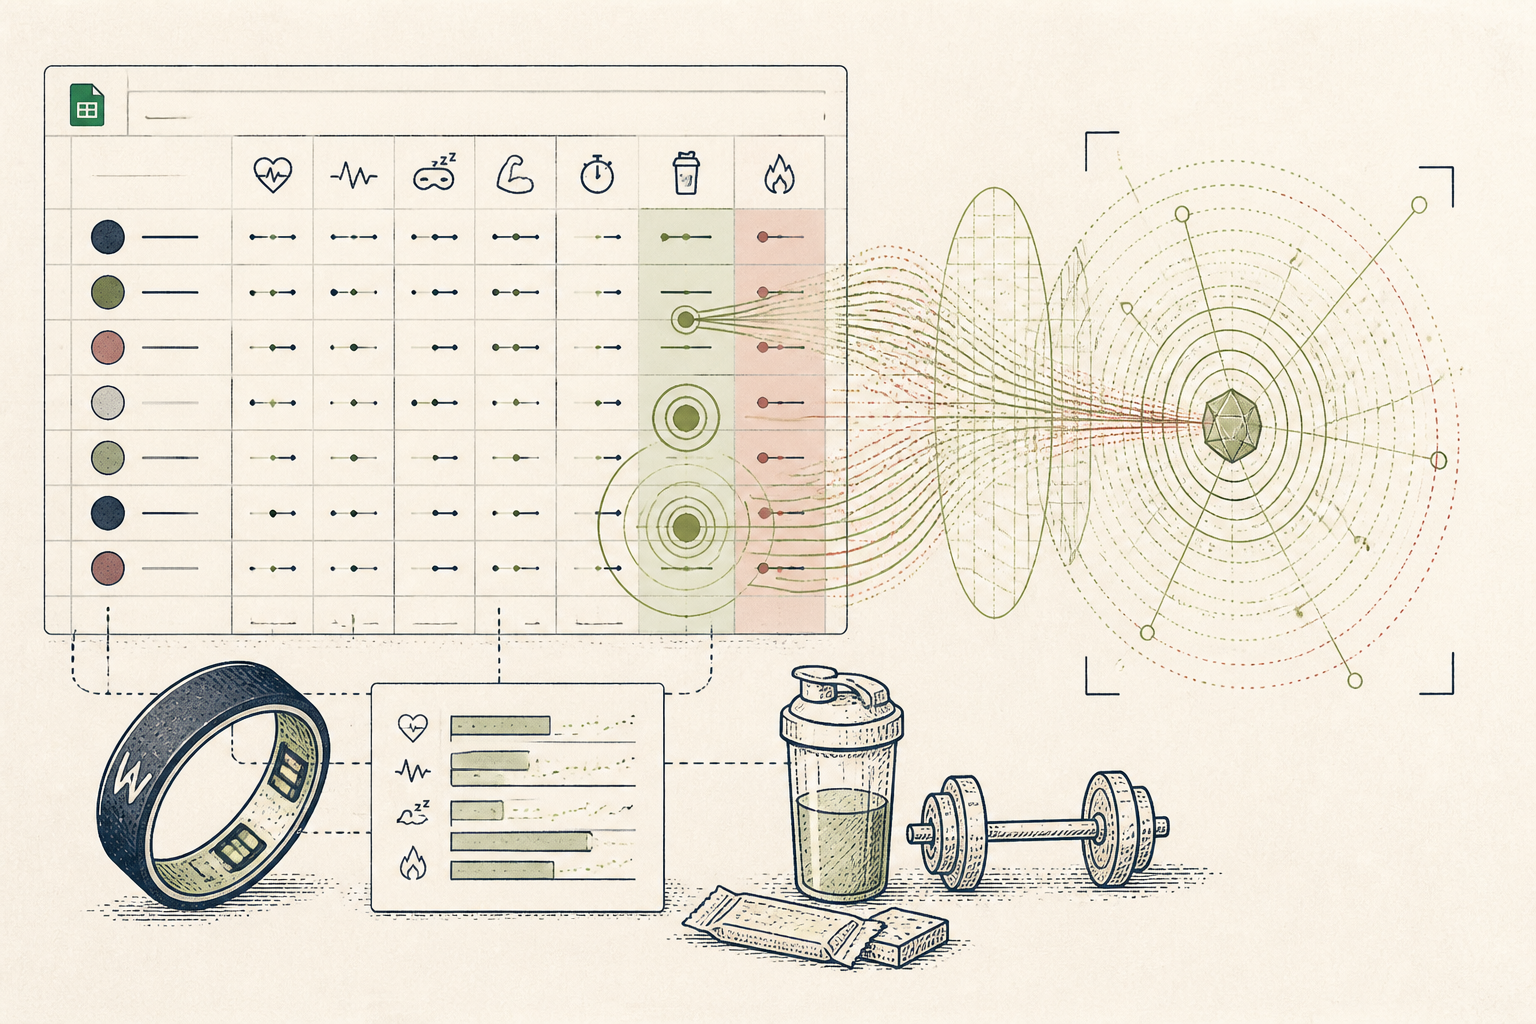
What the AI found
“AI identified a 30% increase in inflammatory markers on recovery days following high-intensity interval training (HIIT) when athletes consumed less than 1.5g/kg body weight of protein, a pattern previously attributed to training load alone.”
Before
Disparate athlete data, subjective recovery advice
After
Integrated data, quantified, personalised recovery plan
The same system, three states — real screens, not a screenshot
| Athlete ID | A001 |
| Training Load (TRIMP) | 250 (HIIT) |
| Sleep Duration (hrs) | 6.8 |
| HRV (RMSSD) | 38 |
Prompt
Analyse the provided athlete data across training intensity, sleep, HRV, and protein intake. Identify any significant correlations between these variables and inflammatory markers on recovery days, particularly after high-intensity sessions. Quantify the impact of any identified nutritional deficiencies on recovery metrics.
Analyse the provided athlete data across training intensity, sleep, HRV, and protein intake. Identify any significant correlations between these variables and inflammatory markers on recovery days, particularly after high-intensity sessions. Quantify the impact of any identified nutritional deficiencies on recovery metrics.
AI
Analysis indicates a strong negative correlation between protein intake on recovery days and inflammatory markers following high-intensity interval training (HIIT). Specifically, athletes consuming less than 1.5g/kg body weight of protein showed a 30% increase in CRP levels (from an average of 2.5 mg/L to 3.25 mg/L) compared to those meeting or exceeding this threshold, irrespective of sleep duration or HRV.↓ 28%
Inflammation (CRP) Post-HIIT
↑ 85%
Recovery Adherence Rate
↑ 1.6 avg
Protein Intake (g/kg)
From Athlete Data to Actionable Recovery Plan
A sports nutritionist transforms disparate athlete data into a unified, actionable recovery strategy using AI-powered analysis.
A nutritionist running a small EU practice, working with semi-pro endurance athletes.
Tools used
The real tools used here — swap any for your own equivalent. Each links to how we’d set it up.
Starting state
Before anything was set up
Before implementing AI, the nutritionist faced a common challenge: a wealth of athlete data scattered across various platforms. Training logs, sleep trackers, and dietary records were all individual silos. This made it difficult to spot overarching patterns, let alone correlate seemingly unrelated metrics to guide precise recovery strategies. Recommendations were often based on general guidelines and subjective athlete feedback, lacking the empirical depth needed for optimal performance.
| Athlete ID | A001 |
| Training Load (TRIMP) | 250 (HIIT) |
| Sleep Duration (hrs) | 6.8 |
| HRV (RMSSD) | 38 |
| Protein Intake (g) | 110 |
| Inflammatory Markers (CRP mg/L) | 3.2 |
Working state
Resources, doing its job
The nutritionist uploaded anonymised athlete data—including training intensity, sleep duration, heart rate variability, and dietary intake—into a Google Sheet. She then used a prompt in Gemini to identify correlations between recovery metrics and nutritional intake following specific training types. The AI's task was to find hidden patterns that might explain suboptimal recovery, allowing for data-driven adjustments to dietary recommendations.
Prompt
Analyse the provided athlete data across training intensity, sleep, HRV, and protein intake. Identify any significant correlations between these variables and inflammatory markers on recovery days, particularly after high-intensity sessions. Quantify the impact of any identified nutritional deficiencies on recovery metrics.
Analyse the provided athlete data across training intensity, sleep, HRV, and protein intake. Identify any significant correlations between these variables and inflammatory markers on recovery days, particularly after high-intensity sessions. Quantify the impact of any identified nutritional deficiencies on recovery metrics.
AI
Analysis indicates a strong negative correlation between protein intake on recovery days and inflammatory markers following high-intensity interval training (HIIT). Specifically, athletes consuming less than 1.5g/kg body weight of protein showed a 30% increase in CRP levels (from an average of 2.5 mg/L to 3.25 mg/L) compared to those meeting or exceeding this threshold, irrespective of sleep duration or HRV.Use case implemented
The finished system, running on its own
With the AI-generated insights, the nutritionist created personalised recovery protocols for her athletes. Each athlete received targeted dietary adjustments based on their specific training responses, focusing on optimising macronutrient timing and intake around key training sessions. The integrated system now provides a clear, quantitative basis for recovery advice, moving beyond guesswork to precise, data-informed interventions that are continually refined.
↓ 28%
Inflammation (CRP) Post-HIIT
↑ 85%
Recovery Adherence Rate
↑ 1.6 avg
Protein Intake (g/kg)
What an outside observer would notice
28%
Reduction in post-HIIT inflammatory markers
85%
Athlete adherence to recovery protocols
1.6 g/kg
Average protein intake on recovery days
The stack — build it yourself
Familiar, flexible, and easily accessible for data collation from various athlete tracking apps.
Its natural language processing capabilities allowed for complex queries and detailed correlation analysis across diverse datasets.
Provides consistent, objective metrics on sleep, HRV, and training strain, feeding directly into the analytical process.
These are the tools used in this story. Any can be swapped for an equivalent you already trust.
Go deeper
Do this yourself
See Resources
This story runs on Resources. The tools and prompts above are the real build — swap any tool for your own equivalent and follow the same steps.