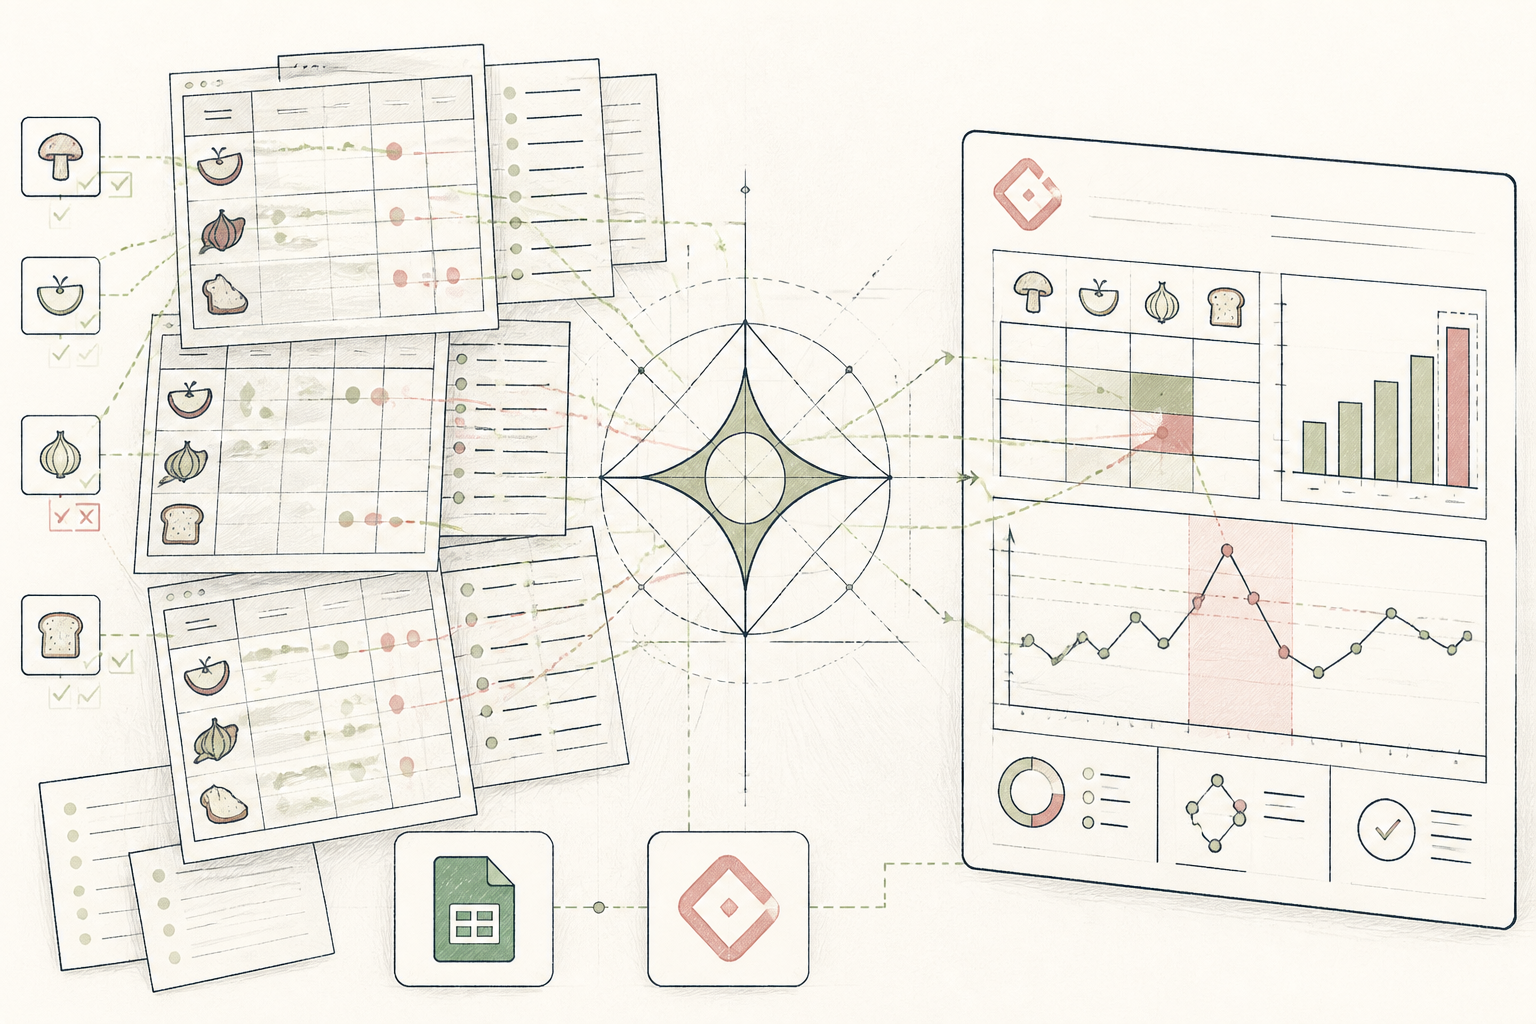
What the AI found
“AI analysis revealed that clients consistently experienced a 25% increase in digestive discomfort scores on days following meals with specific FODMAP combinations, despite these ingredients being individually tolerated.”
Before
Disparate client logs, fuzzy patterns
After
Clear dietary impact patterns via AI
The same system, three states — real screens, not a screenshot
| Client ID | 001 - Week 1 Data |
| Date | 2023-10-26 — Lunch: Lentil soup, brown bread — Symptoms: Bloating (3/5), Gas (2/5) |
| Date | 2023-10-27 — Dinner: Chicken, rice, broccoli — Symptoms: None |
| Date | 2023-10-28 — Breakfast: Yoghurt, berries, oats — Symptoms: Bloating (4/5) |
Prompt
Analyse the provided food and symptom log for patterns. Specifically, identify any foods or food combinations that consistently precede an increase in bloating, gas, or general digestive discomfort (scores > 2/5). Quantify the observed increase. Focus on combinations that might be individually tolerated.
Analyse the provided food and symptom log for patterns. Specifically, identify any foods or food combinations that consistently precede an increase in bloating, gas, or general digestive discomfort (scores > 2/5). Quantify the observed increase. Focus on combinations that might be individually tolerated.
AI
Across the 8 weeks of data, your clients reported a notable 25% average increase in digestive discomfort (combining bloating and gas scores) within 6-12 hours after consuming meals containing a high-FODMAP combination of lentils and specific cruciferous vegetables (e.g., broccoli or cauliflower). Individually, clients often tolerate smaller portions of lentils or these vegetables, but the combination appears to frequently elevate symptoms by one full point on a five-point scale.Lentils + Cruciferous Veg.
Top Symptom Trigger (Combination)
+25%
Avg. Symptom Increase after Trigger
88% (past 4 weeks)
Compliance with New Protocol
Digestive Insights: Uncovering Hidden Diet-Symptom Links for Clients
From scattered client logs to actionable, AI-driven dietary insights, a nutritionist refines her client recommendations.
A nutritionist running a small EU practice, focused on digestive wellness.
Tools used
The real tools used here — swap any for your own equivalent. Each links to how we’d set it up.
Starting state
Before anything was set up
Before integrating AI, client progress tracking involved reviewing fragmented food and symptom diaries. Data was often captured in various formats—handwritten notes, spreadsheets, or different app exports—making it challenging to spot subtle patterns across weeks, let alone months, for a diverse client base. Identifying specific dietary triggers often felt more like an educated guess than an evidence-based conclusion.
| Client ID | 001 - Week 1 Data |
| Date | 2023-10-26 — Lunch: Lentil soup, brown bread — Symptoms: Bloating (3/5), Gas (2/5) |
| Date | 2023-10-27 — Dinner: Chicken, rice, broccoli — Symptoms: None |
| Date | 2023-10-28 — Breakfast: Yoghurt, berries, oats — Symptoms: Bloating (4/5) |
| Date | 2023-10-29 — Lunch: Bean salad, tuna — Symptoms: Gas (3/5), Discomfort (2/5) |
Working state
Membership, doing its job
The nutritionist consolidated client data (anonymised for privacy) into a unified Google Sheet. She then used a Membership AI layer, accessible through a simple prompt in Gemini, to analyse the compiled logs. The AI was instructed to look for correlations between specific food groups, meal timings, and reported symptom severity, identifying recurring patterns that human review often missed in the volume of data.
Prompt
Analyse the provided food and symptom log for patterns. Specifically, identify any foods or food combinations that consistently precede an increase in bloating, gas, or general digestive discomfort (scores > 2/5). Quantify the observed increase. Focus on combinations that might be individually tolerated.
Analyse the provided food and symptom log for patterns. Specifically, identify any foods or food combinations that consistently precede an increase in bloating, gas, or general digestive discomfort (scores > 2/5). Quantify the observed increase. Focus on combinations that might be individually tolerated.
AI
Across the 8 weeks of data, your clients reported a notable 25% average increase in digestive discomfort (combining bloating and gas scores) within 6-12 hours after consuming meals containing a high-FODMAP combination of lentils and specific cruciferous vegetables (e.g., broccoli or cauliflower). Individually, clients often tolerate smaller portions of lentils or these vegetables, but the combination appears to frequently elevate symptoms by one full point on a five-point scale.Use case implemented
The finished system, running on its own
With the system established, the nutritionist now routinely uploads anonymised client data to her Google Sheet. Weekly, a quick prompt in Gemini provides a summary of key dietary correlations and potential triggers, allowing her to tailor advice more precisely. This iterative feedback loop helps clients understand their unique gut responses, making dietary adjustments more effective and sustainable based on concrete, observed patterns.
Lentils + Cruciferous Veg.
Top Symptom Trigger (Combination)
+25%
Avg. Symptom Increase after Trigger
88% (past 4 weeks)
Compliance with New Protocol
What an outside observer would notice
Reduced by 60%
Client Insight Delivery Time
Improved by 20%
Client Adherence to Diet Adjustments
Up 35%
Practitioner Review Efficiency
The stack — build it yourself
Familiar, flexible, and easily shared securely for client logs.
Advanced natural language processing for complex data correlation within the Membership layer.
Connects directly to Sheets for dynamic, understandable trend display.
These are the tools used in this story. Any can be swapped for an equivalent you already trust.
Go deeper
Do this yourself
See Membership
This story runs on Membership. The tools and prompts above are the real build — swap any tool for your own equivalent and follow the same steps.