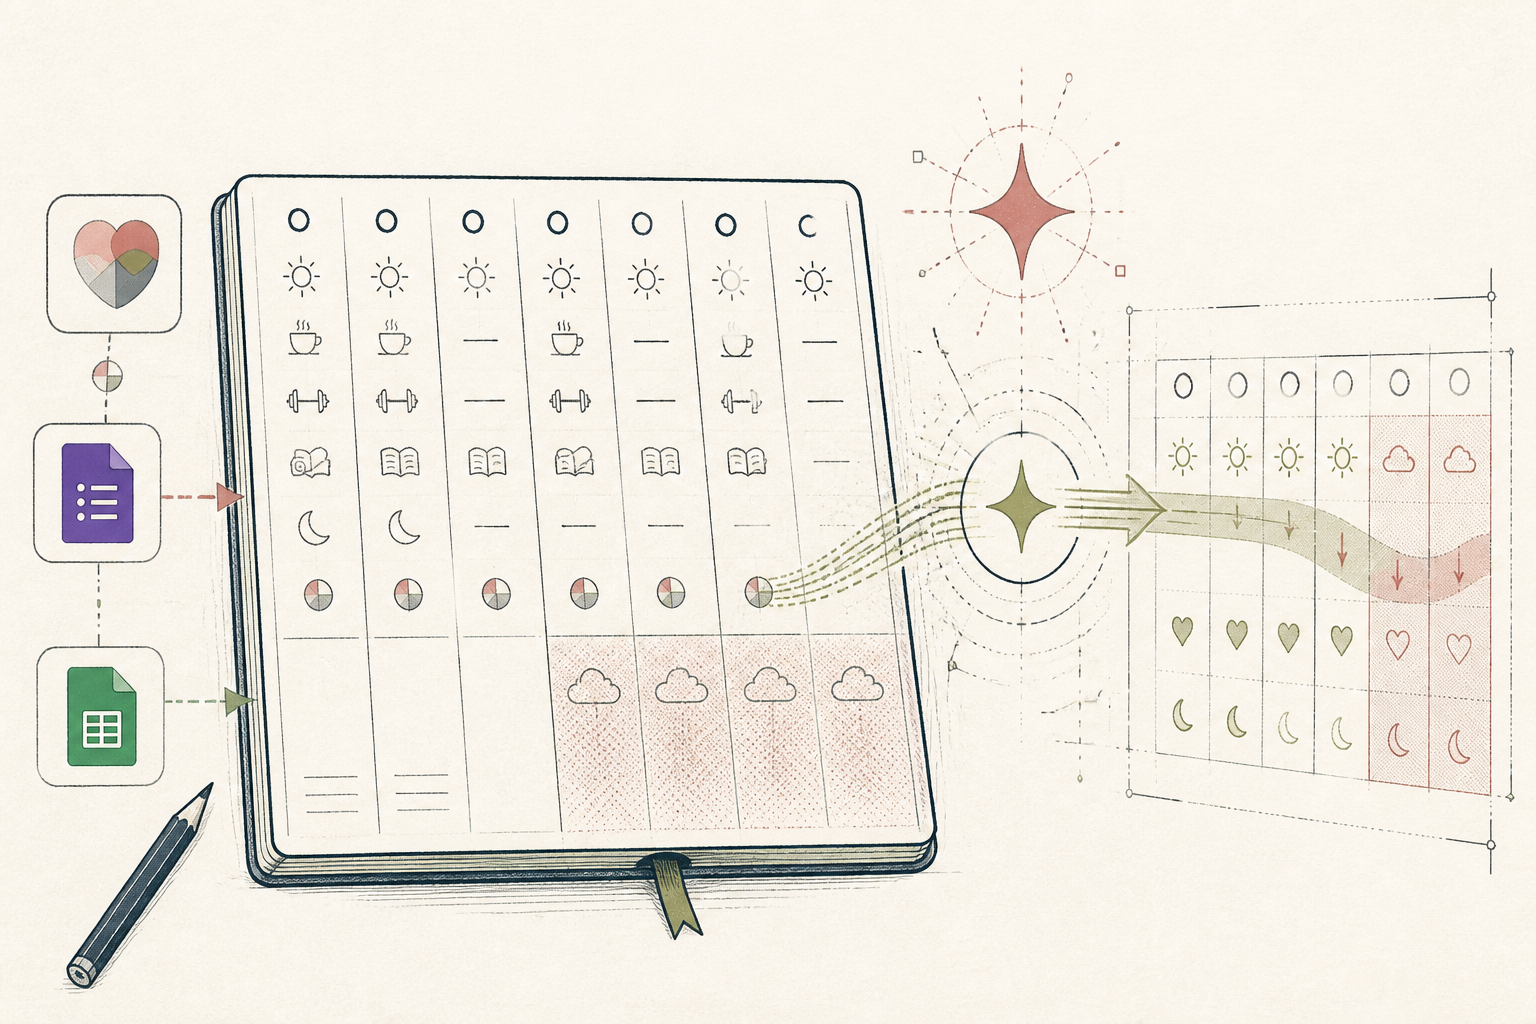
What the AI found
“Your energy dips most predictably for 3.5 days beginning on Day 20 of your cycle, correlating with a 15% increase in reported brain fog during that period across the last three months, not randomly as you'd assumed.”
Before
Sporadic cycle tracking with no clear patterns
After
Predictable weekly energy based on cycle phase
The same system, three states — real screens, not a screenshot
- Day 14: good energy
- Day 20: really tired today?
- Day 22: feeling irritable
- Day 28: period started.
Prompt
Analyse the attached Google Sheet data (columns: Date, Cycle Day, Mood, Energy (1-5), Brain Fog (Y/N), Sleep Hours, Exercise (Y/N)). Identify any recurring patterns or correlations between cycle day, perceived energy, and brain fog over the last three months. Quantify the most significant finding.
Analyse the attached Google Sheet data (columns: Date, Cycle Day, Mood, Energy (1-5), Brain Fog (Y/N), Sleep Hours, Exercise (Y/N)). Identify any recurring patterns or correlations between cycle day, perceived energy, and brain fog over the last three months. Quantify the most significant finding.
AI
Across your last three observed cycles, your energy levels show a consistent dip (average rating 2/5) for approximately 3.5 days, specifically starting on Cycle Day 20. During this period, reported instances of brain fog increased by 15% compared to other cycle phases.| Current Cycle Day | 22 |
| Predicted Energy this Week (Day 22-28) | LOW |
| Recommended Actions | Prioritise focus work, light exercise, schedule restorative activity. |
Daily Cycle Syncing for a More Predictable Week
A structured daily review system transformed sporadic menstrual cycle tracking into a reliable prediction model for weekly energy and mood fluctuations.
A 34-year-old marketing consultant in Northern Europe, managing a demanding schedule and perimenopausal symptoms.
Tools used
The real tools used here — swap any for your own equivalent. Each links to how we’d set it up.
Starting state
Before anything was set up
Before implementing the system, cycle tracking was a disjointed affair. Data points—some recorded in a notebook, others in a period tracking app—were scattered and inconsistent. Attempts to connect daily energy levels with cycle phases felt speculative, often abandoned within a few days due to lack of a clear method. The consultant felt reactive to fluctuating energy and mood, making weekly planning a constant guessing game.
- Day 14: good energy
- Day 20: really tired today?
- Day 22: feeling irritable
- Day 28: period started.
Working state
All-Access, doing its job
The first step was to centralize data. Daily inputs from Apple Health (sleep, activity) and a simple Google Form (mood, energy, specific symptoms) fed into a Google Sheet. The core insight emerged when these disparate data points were fed into Gemini with a specific prompt, revealing a non-obvious correlation between cycle day and specific symptoms, quantified over several cycles.
Prompt
Analyse the attached Google Sheet data (columns: Date, Cycle Day, Mood, Energy (1-5), Brain Fog (Y/N), Sleep Hours, Exercise (Y/N)). Identify any recurring patterns or correlations between cycle day, perceived energy, and brain fog over the last three months. Quantify the most significant finding.
Analyse the attached Google Sheet data (columns: Date, Cycle Day, Mood, Energy (1-5), Brain Fog (Y/N), Sleep Hours, Exercise (Y/N)). Identify any recurring patterns or correlations between cycle day, perceived energy, and brain fog over the last three months. Quantify the most significant finding.
AI
Across your last three observed cycles, your energy levels show a consistent dip (average rating 2/5) for approximately 3.5 days, specifically starting on Cycle Day 20. During this period, reported instances of brain fog increased by 15% compared to other cycle phases.Use case implemented
The finished system, running on its own
With the pattern identified, the consultant now uses a simple weekly review. Each Sunday, she consults a Google Sheet that automatically calculates her current cycle day and highlights the predicted energy zones for the coming week. This foresight allows her to strategically allocate demanding tasks to high-energy days and proactively schedule restorative activities for lower-energy phases, optimizing her work and personal life without constant struggle.
| Current Cycle Day | 22 |
| Predicted Energy this Week (Day 22-28) | LOW |
| Recommended Actions | Prioritise focus work, light exercise, schedule restorative activity. |
What an outside observer would notice
From 0 to 4 per month
Weeks with proactive planning
Reported 'brain fog' days by 15%
Reduction in
6 minutes
Time spent on weekly review
The stack — build it yourself
Automatic and seamless collection of sleep and activity data.
Quick, customisable, and user-friendly for subjective data like mood and energy.
Flexible platform for combining data from various sources and creating simple, actionable dashboards.
Its ability to swiftly process structured data and identify non-obvious correlations across multiple data points was key.
These are the tools used in this story. Any can be swapped for an equivalent you already trust.
Go deeper
Do this yourself
See the full build
This story runs on All-Access. The tools and prompts above are the real build — swap any tool for your own equivalent and follow the same steps.