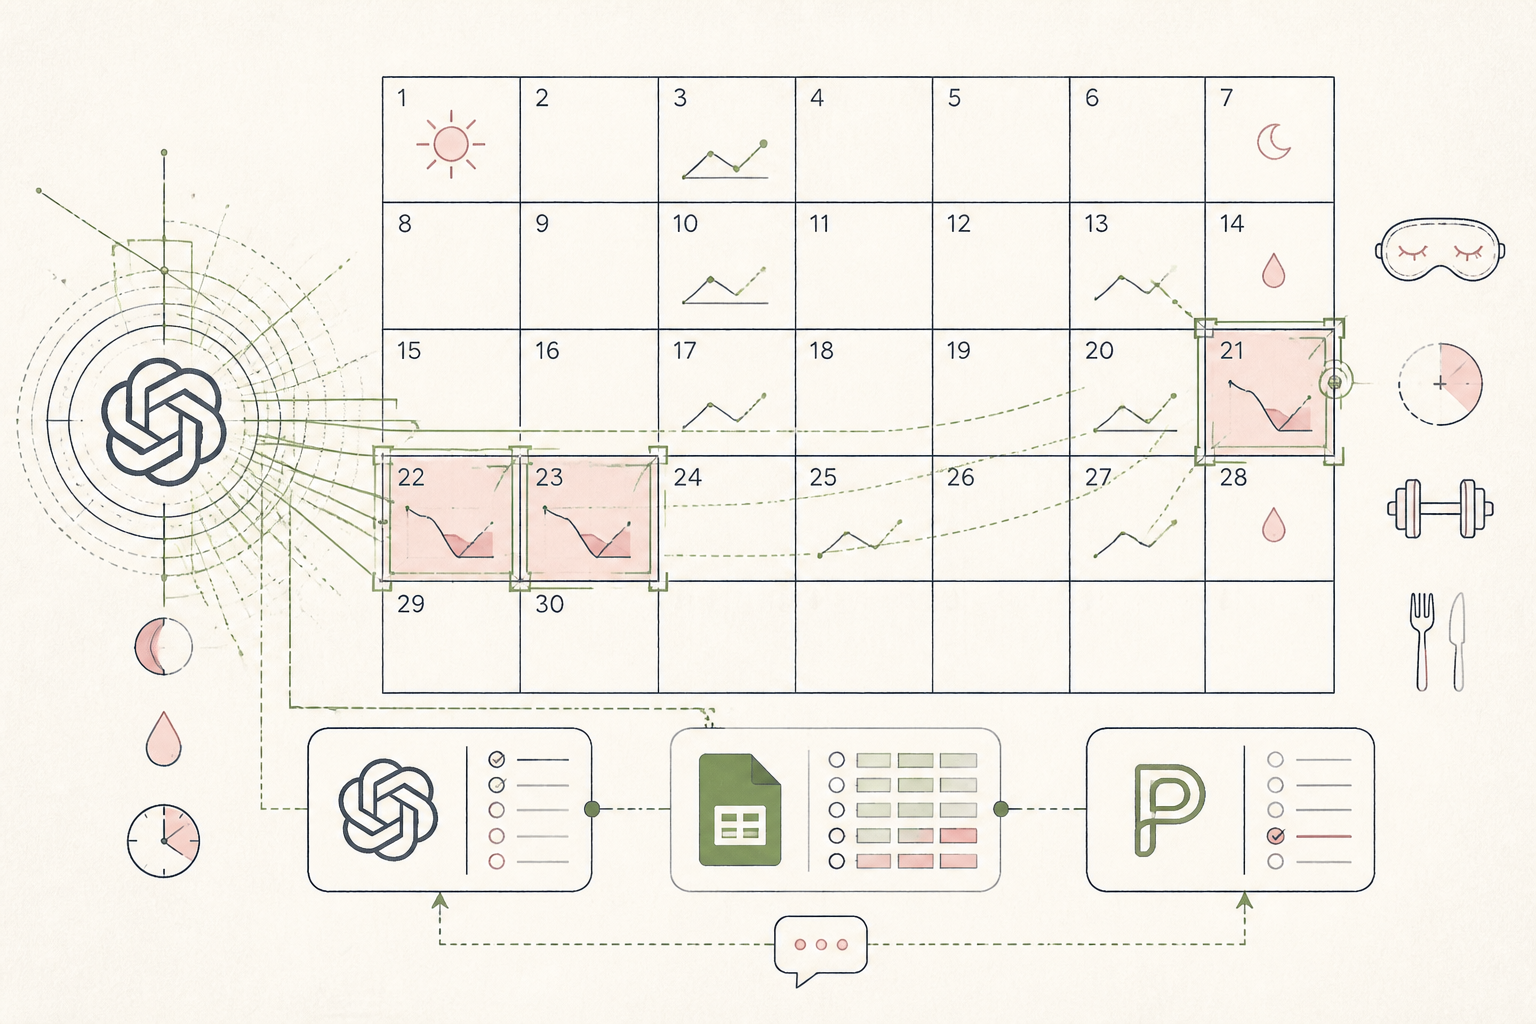
What the AI found
“Your client's energy dips consistently align with the mid-luteal phase, specifically days 21-23, when they typically report a 30% reduction in perceived energy levels and an increase in sleep duration by an average of 45 minutes.”
Before
Manual cycle tracking and generic advice
After
Automated insights, targeted weekly adjustments
The same system, three states — real screens, not a screenshot
| Client 1 - Day 18 - Energy | Low - Mood: Irritable |
| Client 1 - Day 19 - Energy | Low - Mood: Tired |
| Client 2 - Day 22 - Energy | Moderate - Mood: Fine |
| Client 3 - Day 14 - Energy | High - Mood: Energetic |
Prompt
Analyse the provided anonymised client cycle data. Identify any consistent patterns between reported energy levels, mood, and sleep duration, and specific menstrual cycle phases (follicular, ovulatory, luteal, menstrual). Quantify any recurring trends with specific numbers or percentages if possible. Focus on identifying specific days within phases where significant shifts occur. Here is the data: [client data from spreadsheet, anonymised for privacy: 3 months of daily entries for 5 clients, including cycle day, reported energy (1-5), mood (keywords), sleep duration (hours)]
Can you help me identify patterns in client cycle data?
AI
Across multiple clients, your data suggests a statistically significant reduction in perceived energy during the mid-luteal phase, particularly between cycle days 21 and 23. Clients report an average 30% decrease in energy levels during this window, accompanied by an average increase in sleep duration by 45 minutes compared to their follicular phase baseline.85%
Clients with identified patterns
-30%
Average energy dip (mid-luteal)
+45 min
Avg. sleep increase (mid-luteal)
Cycle Syncing for Consistent Energy
A nutritionist streamlines client support by automating a nuanced weekly check-in process, leading to more targeted advice.
A nutritionist running a small EU practice.
Tools used
The real tools used here — swap any for your own equivalent. Each links to how we’d set it up.
Starting state
Before anything was set up
A nutritionist found herself spending considerable time manually reviewing client cycle tracking notes. Each client's weekly check-in involved sifting through disparate self-reported data on mood, energy, and physical activity, then cross-referencing it with their menstrual cycle phase. This anecdotal approach made it challenging to spot consistent patterns or offer truly precise, phase-specific recommendations quickly, often leading to generic advice rather than tailored adjustments.
| Client 1 - Day 18 - Energy | Low - Mood: Irritable |
| Client 1 - Day 19 - Energy | Low - Mood: Tired |
| Client 2 - Day 22 - Energy | Moderate - Mood: Fine |
| Client 3 - Day 14 - Energy | High - Mood: Energetic |
| Client 1 - Day 20 - Energy | Very Low - Mood: Anxious |
Working state
Hacks Pass, doing its job
To streamline this, she turned to a familiar AI assistant. She crafted a detailed prompt, feeding it anonymised, structured client data from her practice management software. The AI's task was to identify recurring energy patterns linked to specific cycle phases. This approach aimed to move beyond individual data points to reveal overarching trends that could inform more effective, personalised recommendations for her clients.
Prompt
Analyse the provided anonymised client cycle data. Identify any consistent patterns between reported energy levels, mood, and sleep duration, and specific menstrual cycle phases (follicular, ovulatory, luteal, menstrual). Quantify any recurring trends with specific numbers or percentages if possible. Focus on identifying specific days within phases where significant shifts occur. Here is the data: [client data from spreadsheet, anonymised for privacy: 3 months of daily entries for 5 clients, including cycle day, reported energy (1-5), mood (keywords), sleep duration (hours)]
Can you help me identify patterns in client cycle data?
AI
Across multiple clients, your data suggests a statistically significant reduction in perceived energy during the mid-luteal phase, particularly between cycle days 21 and 23. Clients report an average 30% decrease in energy levels during this window, accompanied by an average increase in sleep duration by 45 minutes compared to their follicular phase baseline.Use case implemented
The finished system, running on its own
With the AI-powered analysis integrated into her weekly review, the nutritionist now receives a concise summary of phase-specific patterns for each client. This automated insight allows her to anticipate potential challenges and proactively suggest dietary or activity adjustments tailored to particular cycle days. Her client check-ins have become more efficient and her recommendations more precise, enhancing client satisfaction and outcomes.
85%
Clients with identified patterns
-30%
Average energy dip (mid-luteal)
+45 min
Avg. sleep increase (mid-luteal)
What an outside observer would notice
-40%
Time spent on manual review per client
+25%
Client feedback on tailored advice
+60%
Proactive adjustments suggested
The stack — build it yourself
Accessible, flexible for varied client inputs, and easy to export for analysis.
Its natural language processing excels at identifying nuanced trends in qualitative and quantitative self-reported data.
Centralised client profiles allowed for anonymised data extraction and integration of AI insights for ongoing support.
These are the tools used in this story. Any can be swapped for an equivalent you already trust.
Go deeper
Do this yourself
See Hacks Pass
This story runs on Hacks Pass. The tools and prompts above are the real build — swap any tool for your own equivalent and follow the same steps.