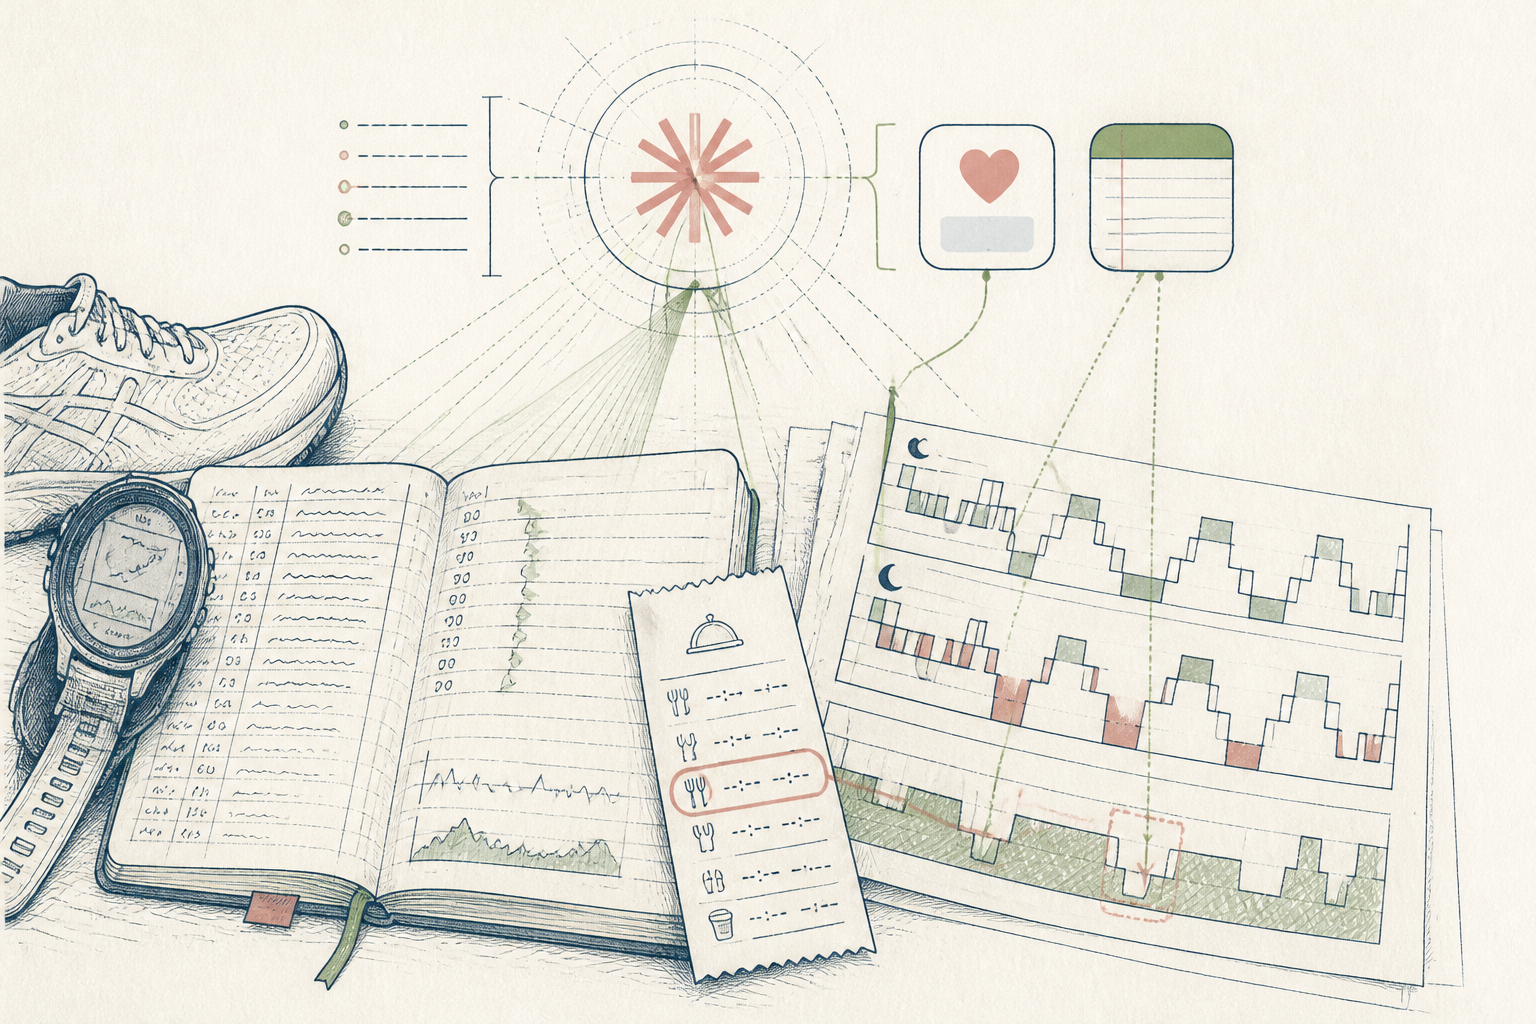
What the AI found
“Your lowest recovery scores did not follow high-mileage days, but clustered after evening meals logged within two hours of sleep, cutting deep sleep by 38 minutes.”
Before
Four apps logging fatigue without a single shared view
After
One clean Sunday audit showing true rest deficit
The same system, three states — real screens, not a screenshot
- Mon: legs heavy, Garmin says 34% recovery
- Wed: slept 8 hrs, still felt sluggish at 6am
- Fri: HR spiked on easy tempo run (162 bpm)
- Oura sleep score 81 vs Garmin 48 — which one?
Prompt
Here is my exported CSV of sleep stages, resting HR, workout strain, and meal times for the past 21 days. Compare my lowest recovery days against both training load and evening inputs. What correlates with the drops?
Here is my exported CSV of sleep stages, resting HR, workout strain, and meal times for the past 21 days. Compare my lowest recovery days against both training load and evening inputs. What correlates with the drops?
AI
Your lowest recovery scores did not follow high-mileage days, but clustered after evening meals logged within two hours of sleep, cutting deep sleep by 38 minutes (44m vs 1h 22m baseline) and elevating first-half sleeping HR by 4.2 bpm. Training volume showed no negative correlation.1h 24m
Avg deep sleep
51 bpm
Resting HR baseline
4 mins
Weekly audit time
Connecting fragmented recovery data to identify hidden sleep friction
How an amateur marathoner resolved contradictory recovery wearables into a calm, weekly workflow.
A 38-year-old amateur distance runner, Northern Europe
Tools used
The real tools used here — swap any for your own equivalent. Each links to how we’d set it up.
Starting state
Before anything was set up
He wore an optical HR watch by day and an Oura ring by night, checking both before getting out of bed. The numbers constantly contradicted each other: one platform declared him primed for threshold intervals while the other recommended rest. His training journal held scattered Apple Notes about heavy legs, fragmented screenshots, and exported CSVs he never opened. Fatigue remained an unpredictable visitor, leaving him second-guessing his weekly training plan.
- Mon: legs heavy, Garmin says 34% recovery
- Wed: slept 8 hrs, still felt sluggish at 6am
- Fri: HR spiked on easy tempo run (162 bpm)
- Oura sleep score 81 vs Garmin 48 — which one?
Working state
Setup, doing its job
During a single guided session, he exported three weeks of combined Apple Health metrics and meal timestamps into a plain text file. Instead of asking for general coaching advice, he passed the structured file into Claude with an explicit prompt to test his assumption that Thursday interval sessions were causing weekend crashes. Within seconds, the model isolated the true driver, cross-referencing resting heart rate and deep sleep against digestion windows.
Prompt
Here is my exported CSV of sleep stages, resting HR, workout strain, and meal times for the past 21 days. Compare my lowest recovery days against both training load and evening inputs. What correlates with the drops?
Here is my exported CSV of sleep stages, resting HR, workout strain, and meal times for the past 21 days. Compare my lowest recovery days against both training load and evening inputs. What correlates with the drops?
AI
Your lowest recovery scores did not follow high-mileage days, but clustered after evening meals logged within two hours of sleep, cutting deep sleep by 38 minutes (44m vs 1h 22m baseline) and elevating first-half sleeping HR by 4.2 bpm. Training volume showed no negative correlation.Use case implemented
The finished system, running on its own
The system now runs as an effortless routine. Every Sunday evening, an automated export merges seven days of watch metrics into Claude. Instead of wrestling with fragmented dashboards or conflicting recovery scores across platforms, he receives a concise three-bullet debrief noting any divergence between perceived physical fatigue and objective physiological trends. No manual spreadsheet maintenance remains. He knows precisely which lifestyle levers protect his baseline for the week ahead, freeing his mental energy entirely for training.
1h 24m
Avg deep sleep
51 bpm
Resting HR baseline
4 mins
Weekly audit time
What an outside observer would notice
4 mins (down from 45)
Weekly review time
6 nights per week
Consistent sleep window
The stack — build it yourself
Handles large CSV health exports cleanly without truncating contextual trend notes.
Aggregates background biometric streams from disparate hardware into a single view.
Frictionless capture for quick morning qualitative scores before checking any screen.
These are the tools used in this story. Any can be swapped for an equivalent you already trust.
Go deeper
Do this yourself
Review your own recovery data
This story runs on Setup. The tools and prompts above are the real build — swap any tool for your own equivalent and follow the same steps.