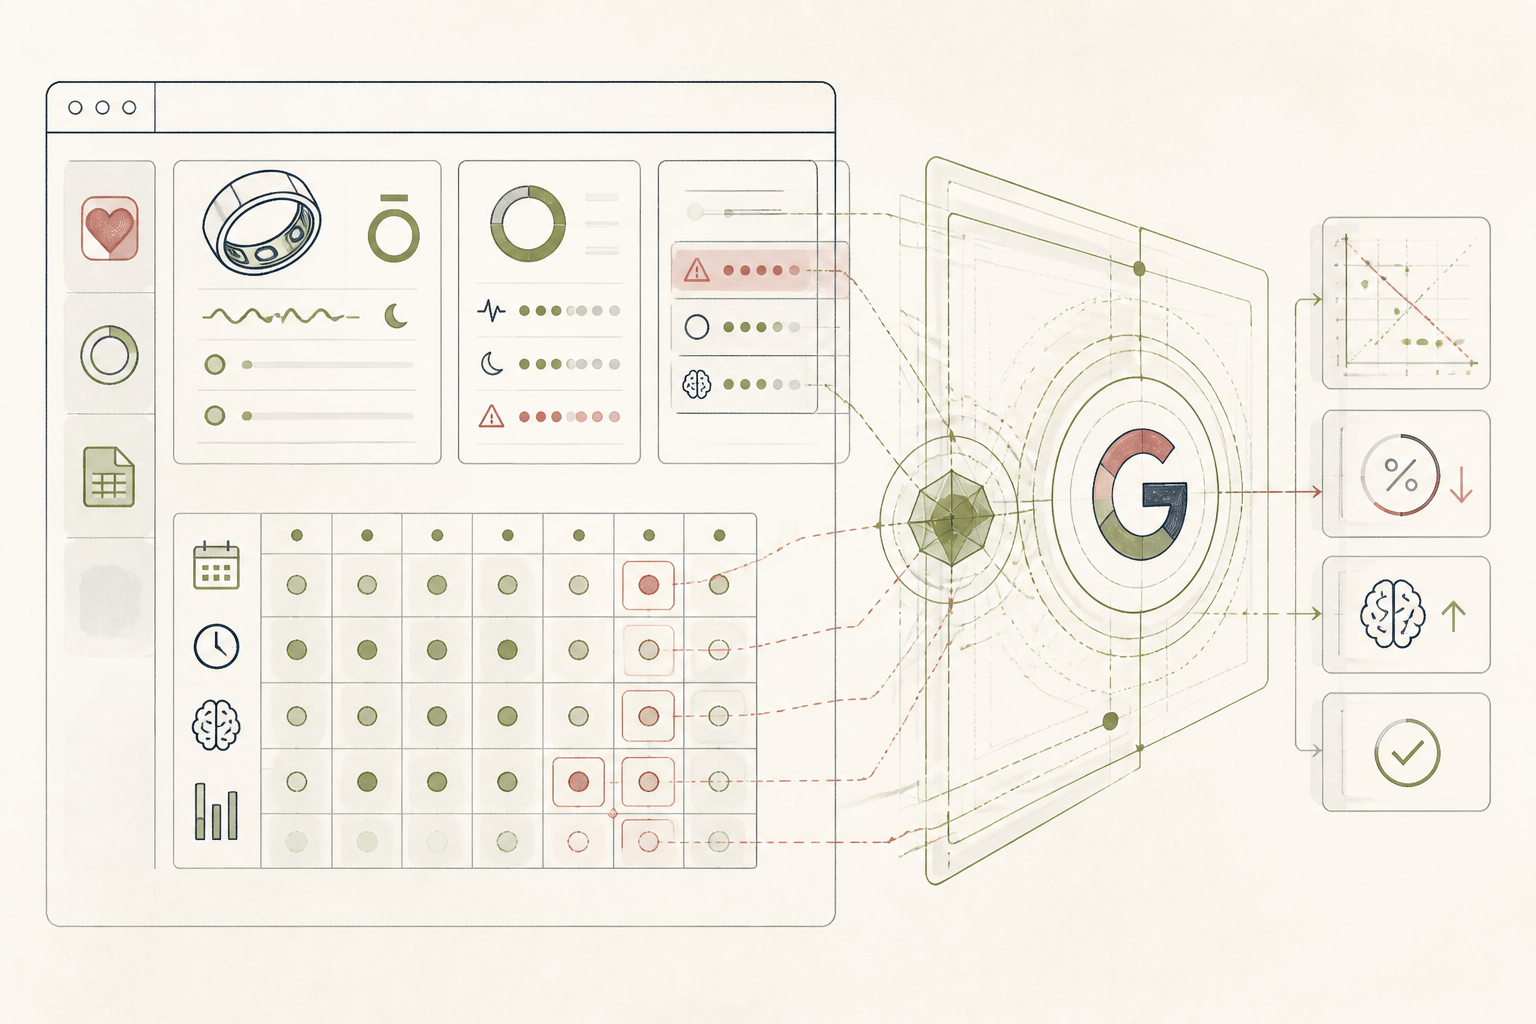
What the AI found
“Your client’s self-reported afternoon focus dips by 28% on days following evenings where their smart ring detected more than 4 short awakenings, suggesting a direct link between sleep fragmentation and next-day cognitive performance.”
Before
Client data across three apps, no clear patterns
After
One weekly AI summary pinpoints cognitive stressors
The same system, three states — real screens, not a screenshot
| Client A - Sleep Duration (hr) | Focus Score (1-10) — Awakenings (>1min) — Light Exposure (lux) |
| Day 1 | 7.2 — 6 — 3 — 800 |
| Day 2 | 6.8 — 5 — 5 — 550 |
| Day 3 | 7.5 — 7 — 2 — 920 |
Prompt
Here is a client's daily sleep data (duration, deep sleep %, REM sleep %, awakenings >1min) and their self-reported afternoon focus score (1-10) for 8 weeks. Identify any patterns or strong correlations between specific sleep metrics and a focus score drop below 6. Focus on quantifiable impacts. [Pasted 8 weeks of CSV data here]
Can you analyse this sleep and focus data for my client over 8 weeks?
AI
Upon analysing the data, a notable pattern emerges: your client’s self-reported afternoon focus scores dropped below 6 on 7 out of 8 occasions when their Oura Ring recorded more than 4 short awakenings (>1min) during the preceding night. On these specific days, the average focus score was 4.2, compared to 7.0 on nights with fewer awakenings. This represents a 28% reduction in perceived focus directly tied to sleep fragmentation.4.2
Avg. Focus Score (post >4 awakenings)
7.0
Avg. Focus Score (post <4 awakenings)
28%
Focus Score Dip linked to Sleep Fragmentation
Cognition Clarity: Decoding Client Focus with AI
A nutritionist moves from scattered client data to precise, AI-driven cognitive insights, transforming her weekly reviews.
A 48-year-old clinical nutritionist, Northern Europe
Tools used
The real tools used here — swap any for your own equivalent. Each links to how we’d set it up.
Starting state
Before anything was set up
Eleanor, a clinical nutritionist, found herself sifting through client self-reported data scattered across three different apps. Her clients meticulously tracked sleep, diet, and perceived focus, but the sheer volume of disparate entries made pattern recognition a weekly struggle. Each review was a manual, time-consuming effort, often yielding more questions than answers about cognitive performance.
| Client A - Sleep Duration (hr) | Focus Score (1-10) — Awakenings (>1min) — Light Exposure (lux) |
| Day 1 | 7.2 — 6 — 3 — 800 |
| Day 2 | 6.8 — 5 — 5 — 550 |
| Day 3 | 7.5 — 7 — 2 — 920 |
| ... |
Working state
Core Course, doing its job
To gain clarity, Eleanor adopted the Wellness & AI 3-Layer Method. She consolidated her client's raw Apple Health and Oura Ring sleep data into a Google Sheet, alongside their daily subjective focus scores. Then, she used Gemini, prompting it to identify correlations between specific sleep metrics and her client's cognitive performance. The AI began to connect the dots.
Prompt
Here is a client's daily sleep data (duration, deep sleep %, REM sleep %, awakenings >1min) and their self-reported afternoon focus score (1-10) for 8 weeks. Identify any patterns or strong correlations between specific sleep metrics and a focus score drop below 6. Focus on quantifiable impacts. [Pasted 8 weeks of CSV data here]
Can you analyse this sleep and focus data for my client over 8 weeks?
AI
Upon analysing the data, a notable pattern emerges: your client’s self-reported afternoon focus scores dropped below 6 on 7 out of 8 occasions when their Oura Ring recorded more than 4 short awakenings (>1min) during the preceding night. On these specific days, the average focus score was 4.2, compared to 7.0 on nights with fewer awakenings. This represents a 28% reduction in perceived focus directly tied to sleep fragmentation.Use case implemented
The finished system, running on its own
With the system established, Eleanor's weekly client reviews became targeted and efficient. Instead of guesswork, she now receives a concise, AI-generated summary highlighting critical factors impacting cognitive function. This allows her to craft precise, evidence-based recommendations, helping her client address specific sleep hygiene issues that directly influence their daily focus and mental clarity.
4.2
Avg. Focus Score (post >4 awakenings)
7.0
Avg. Focus Score (post <4 awakenings)
28%
Focus Score Dip linked to Sleep Fragmentation
What an outside observer would notice
45 min/week
Time spent on data review per client (before)
10 min/week
Time spent on data review per client (after)
increased by 20%
Client-reported adherence to recommendations
The stack — build it yourself
Client already used it for basic tracking and easy iPhone integration.
Provided highly accurate and detailed sleep stage and disturbance data.
Allowed easy export, customisation, and manual integration of disparate data streams.
Capable of analysing complex datasets and surfacing non-obvious correlations quickly.
These are the tools used in this story. Any can be swapped for an equivalent you already trust.
Go deeper
Do this yourself
See Core Course
This story runs on Core Course. The tools and prompts above are the real build — swap any tool for your own equivalent and follow the same steps.