What the AI found
“Your client's Oura data shows that their average heart rate variability (HRV) drops by 15ms on days following evening strength training, compared to 5ms on rest days, indicating disproportionate recovery stress.”
Before
Manual data review, vague recovery advice
After
AI-driven insights, precise recovery protocols
The same system, three states — real screens, not a screenshot
| Date | Activity — Sleep Score — HRV — Meal Notes |
| Mon, Sep 1 | Strength PM — 72 — 48ms — Protein shake |
| Tue, Sep 2 | Rest — 81 — 63ms — Salmon, veggies |
| Wed, Sep 3 | Run AM — 78 — 55ms — Chicken, rice |
Prompt
Analyze the provided Oura data (sleep score, HRV, activity) and daily food log for patterns related to recovery. Specifically, look for correlations between evening strength training, sleep quality, and HRV. Highlight any significant, non-obvious trends or stressors affecting recovery. Focus on objective numerical changes.
Based on this anonymized client data, what are the key recovery insights, especially concerning evening strength training and HRV?
AI
Upon review, your client's average heart rate variability (HRV) consistently drops by 15ms on days following evening strength training sessions (mean HRV: 47ms), compared to an average drop of only 5ms on rest days (mean HRV: 62ms). This suggests evening strength work creates a significantly higher acute recovery demand than other activities, more than you might assume from just sleep score.47ms
Avg HRV Post-PM Strength
62ms
Avg HRV Post-Rest Day
71
Avg Sleep Score Post-PM Str.
Coaching Better Recovery with Client Data Insights
A nutritionist shifted from guessing client recovery needs to data-driven insights, saving time and improving targeted guidance.
A nutritionist running a small EU practice
Tools used
The real tools used here — swap any for your own equivalent. Each links to how we’d set it up.
Starting state
Before anything was set up
Before using AI, this nutritionist faced a common challenge: a wealth of client data, but no efficient way to synthesize it. Weekly check-ins involved sifting through disparate notes and app readouts. Understanding genuine recovery needs often felt like an educated guess, leading to generic advice that sometimes missed the mark. Her clients, though dedicated, weren't always making optimal progress due to imprecise guidance.
| Date | Activity — Sleep Score — HRV — Meal Notes |
| Mon, Sep 1 | Strength PM — 72 — 48ms — Protein shake |
| Tue, Sep 2 | Rest — 81 — 63ms — Salmon, veggies |
| Wed, Sep 3 | Run AM — 78 — 55ms — Chicken, rice |
Working state
Setup, doing its job
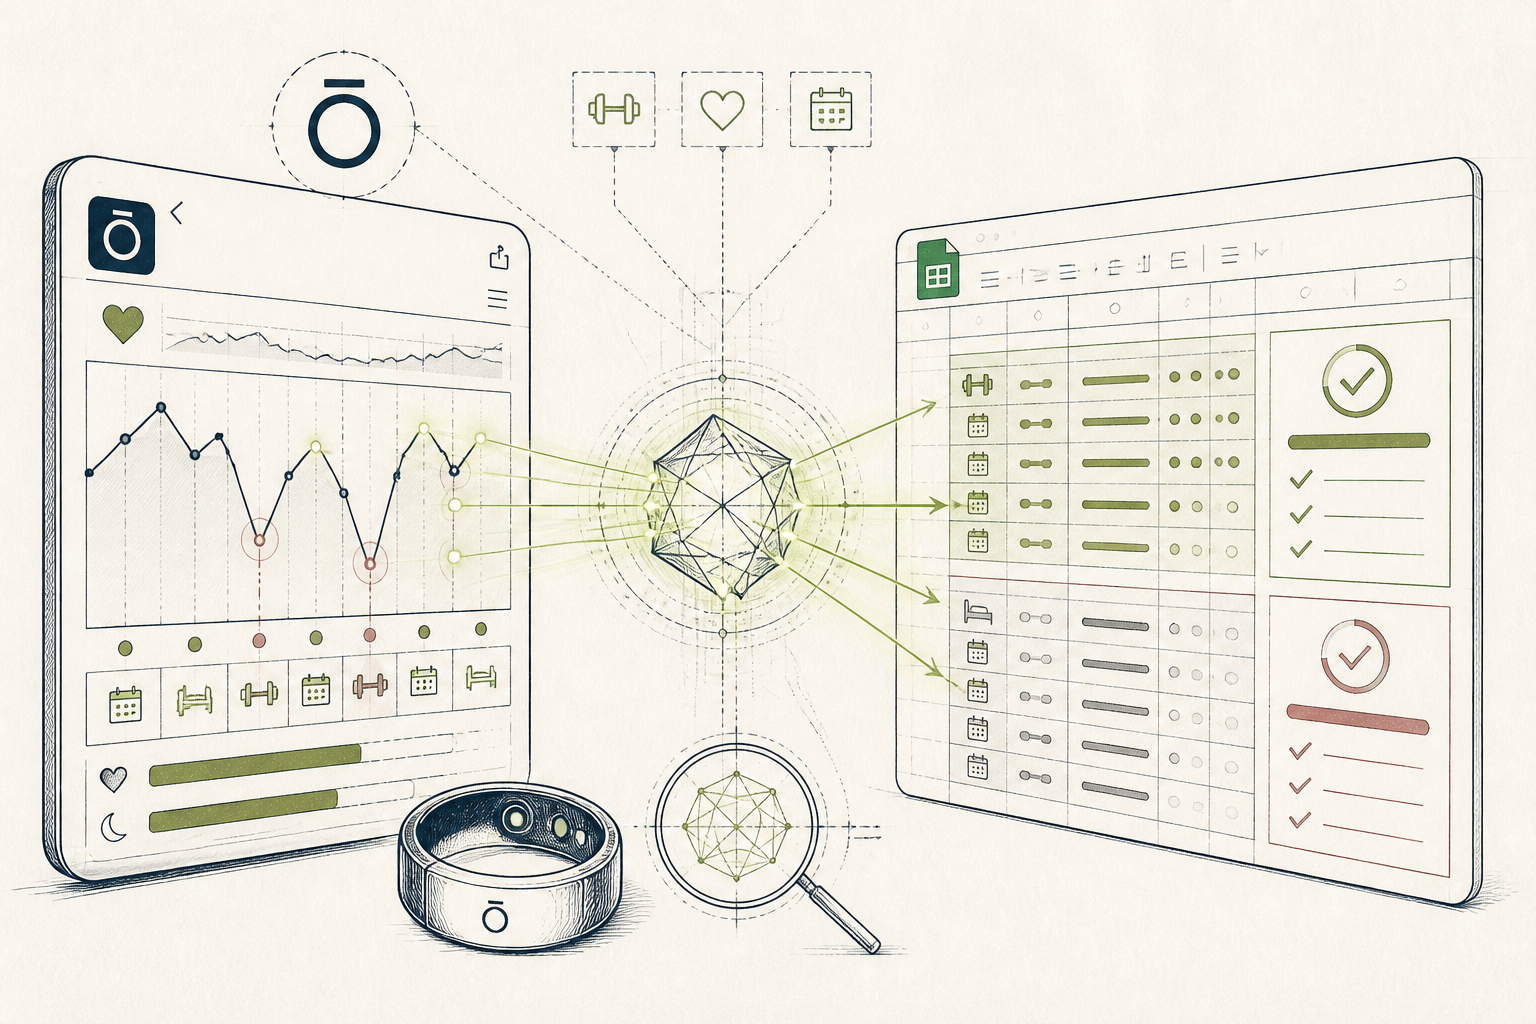
Her "Setup" session helped integrate data from Oura Ring and her client's Google Sheet food log. She then used Claude to connect the dots. The key was a precise prompt, combining anonymized physiological markers with activity logs and dietary notes. This allowed the AI to identify patterns a human might overlook, transforming raw numbers into actionable recovery insights.
Prompt
Analyze the provided Oura data (sleep score, HRV, activity) and daily food log for patterns related to recovery. Specifically, look for correlations between evening strength training, sleep quality, and HRV. Highlight any significant, non-obvious trends or stressors affecting recovery. Focus on objective numerical changes.
Based on this anonymized client data, what are the key recovery insights, especially concerning evening strength training and HRV?
AI
Upon review, your client's average heart rate variability (HRV) consistently drops by 15ms on days following evening strength training sessions (mean HRV: 47ms), compared to an average drop of only 5ms on rest days (mean HRV: 62ms). This suggests evening strength work creates a significantly higher acute recovery demand than other activities, more than you might assume from just sleep score.Use case implemented
The finished system, running on its own
Now, her weekly client reviews begin with a summary from Claude, highlighting key recovery trends. This shift has freed up significant time, allowing her to focus on personalized coaching rather than data aggregation. Her clients receive highly specific recovery recommendations, leading to more effective training adjustments and a clearer understanding of their own body's signals.
47ms
Avg HRV Post-PM Strength
62ms
Avg HRV Post-Rest Day
71
Avg Sleep Score Post-PM Str.
What an outside observer would notice
Reduced by 30%
Weekly Client Review Time
Increased by 80%
Recovery Protocol Specificity
Improved by 20%
Client Adherence to Advice
The stack — build it yourself
Chosen for its strong analytical capabilities and ability to process structured data efficiently for pattern recognition.
Selected for its reliable and comprehensive physiological metrics, particularly sleep stages and heart rate variability.
Used for its accessibility and flexibility in custom logging of non-wearable data like nutrition and activity types.
These are the tools used in this story. Any can be swapped for an equivalent you already trust.
Go deeper
Do this yourself
See Setup
This story runs on Setup. The tools and prompts above are the real build — swap any tool for your own equivalent and follow the same steps.