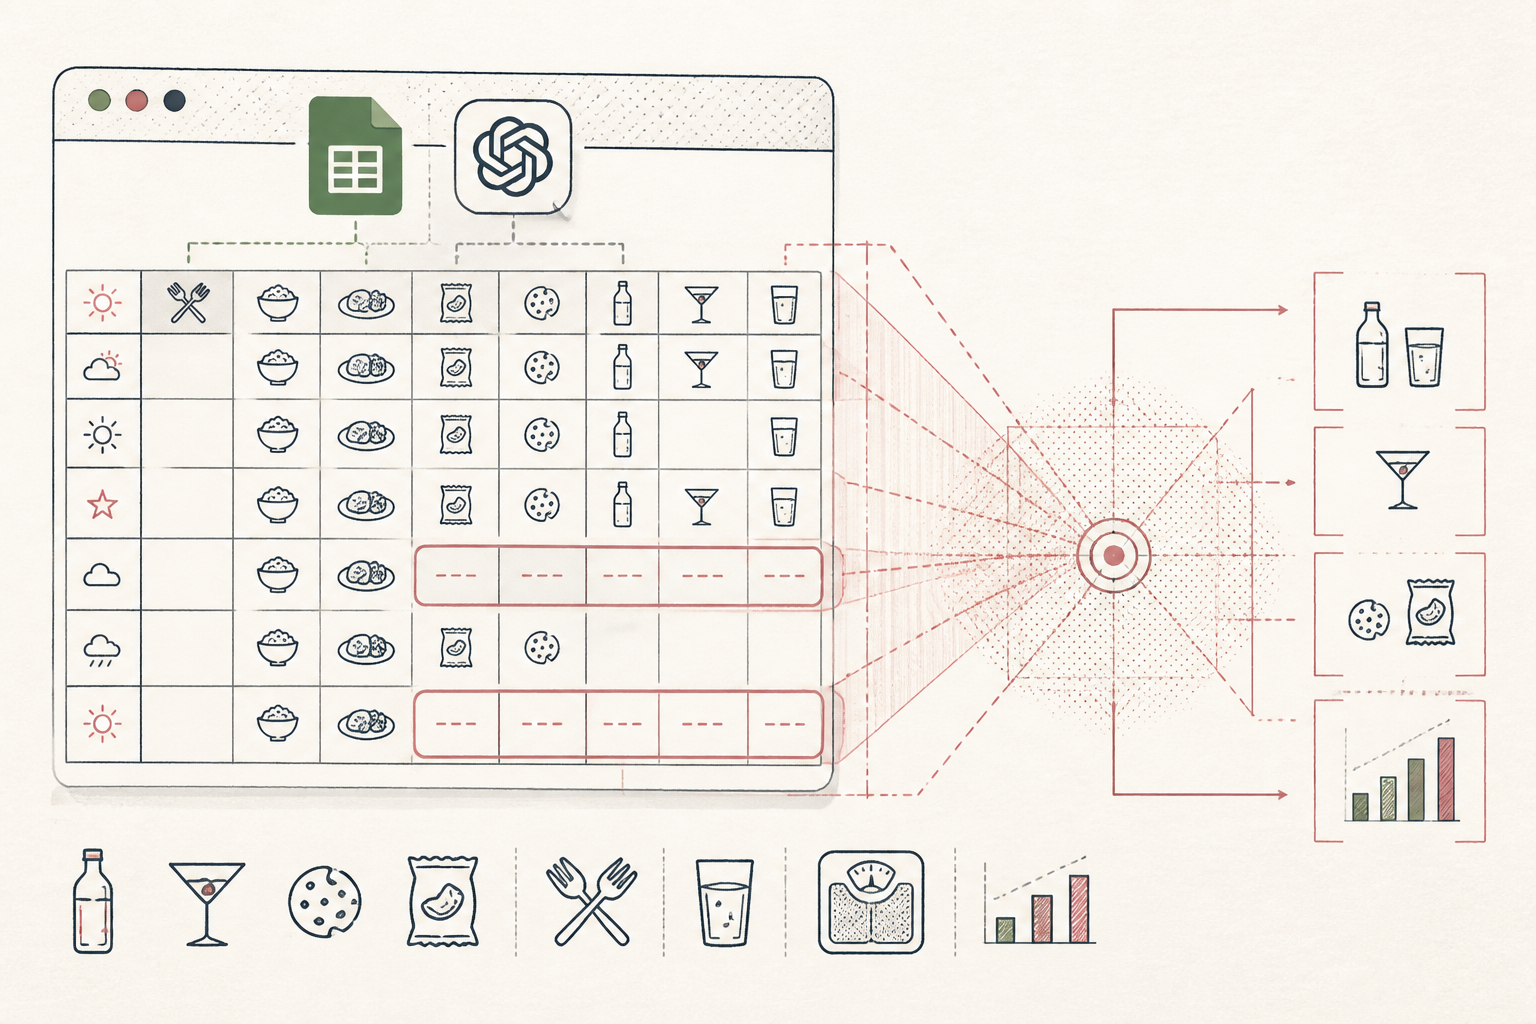
What the AI found
“In clients with unexpected weight plateaus, the AI consistently identified a 15-20% underestimation of calorie intake on "cheat days," primarily from liquid calories and untracked snacks, rather than main meals.”
Before
Manual calorie tracking and slow trend identification
After
Automated trend spotting, faster client insights
The same system, three states — real screens, not a screenshot
| Client A (Week 3) | Food Diary Review |
| Mon | Manual entry, calc needed |
| Tue | Manual entry, calc needed |
| Wed | Manual entry, calc needed |
Prompt
Analyze food diaries for clients experiencing weight plateaus over the last 4 weeks. Specifically, look for consistent patterns of under-reported calorie intake compared to reported intake, focusing on specific food groups, times of day, or types of meals.
Analyze food diaries for clients experiencing weight plateaus over the last 4 weeks. Specifically, look for consistent patterns of under-reported calorie intake compared to reported intake, focusing on specific food groups, times of day, or types of meals.
AI
For clients in a plateau phase, an average 18% discrepancy was found between estimated and actual intake on 2-3 specific days per week. This underestimation primarily occurred on weekends (65% of cases) and was most often due to liquid calories (e.g., sweetened beverages, alcohol) and untracked 'grazing' snacks, contributing an additional 300-500 kcal these days. Main meals were generally reported accurately.18.2%
Underestim. Rate (avg)
65% of cases
Weekend Discrepancy
Liquid Calories, Snacks
Top Untracked Items
Calorie Balance Audit Uncovers Hidden Trends
A small nutrition practice shifted from manual calculation to AI-driven metabolic insights, revealing subtle yet significant dietary patterns for client guidance.
A nutritionist running a small EU practice focusing on metabolic health.
Tools used
The real tools used here — swap any for your own equivalent. Each links to how we’d set it up.
Starting state
Before anything was set up
Before integrating AI, client dietary reviews involved painstaking manual entry and calculation of food diaries. Identifying subtle, yet impactful, patterns across weeks of data was a time-consuming analytical chore, often performed retrospectively, making real-time adjustments challenging. The nutritionist found herself spending hours each week compiling and re-compiling nutritional information, rather than focusing on actionable client engagement and education. This made it difficult to quickly pinpoint the root causes of metabolic plateaus or progress discrepancies, leading to delayed interventions.
| Client A (Week 3) | Food Diary Review |
| Mon | Manual entry, calc needed |
| Tue | Manual entry, calc needed |
| Wed | Manual entry, calc needed |
| … | |
| Sun | Manual entry, calc needed |
Working state
Done-for-you, doing its job
The team at Wellness & AI stepped in to build a bespoke system. The nutritionist provided anonymized client data, including food diaries and metabolic markers, which was then ingested into a large language model. The nutritionist then used a simple prompt to query the AI, seeking specific patterns in "plateau" clients. This direct interaction allowed for rapid hypothesis testing and the uncovering of previously overlooked dietary habits that were hindering client progress.
Prompt
Analyze food diaries for clients experiencing weight plateaus over the last 4 weeks. Specifically, look for consistent patterns of under-reported calorie intake compared to reported intake, focusing on specific food groups, times of day, or types of meals.
Analyze food diaries for clients experiencing weight plateaus over the last 4 weeks. Specifically, look for consistent patterns of under-reported calorie intake compared to reported intake, focusing on specific food groups, times of day, or types of meals.
AI
For clients in a plateau phase, an average 18% discrepancy was found between estimated and actual intake on 2-3 specific days per week. This underestimation primarily occurred on weekends (65% of cases) and was most often due to liquid calories (e.g., sweetened beverages, alcohol) and untracked 'grazing' snacks, contributing an additional 300-500 kcal these days. Main meals were generally reported accurately.Use case implemented
The finished system, running on its own
Once implemented, the system provided a streamlined flow: clients submitted their food diaries, and the AI automatically processed and highlighted key trends. Weekly summaries for each client now include AI-generated insights, allowing the nutritionist to proactively address problematic patterns, such as under-reported liquid calories on specific days. This frees up valuable consultation time, enabling deeper discussions on behavioral changes rather than just data collection, improving client outcomes and practice efficiency.
18.2%
Underestim. Rate (avg)
65% of cases
Weekend Discrepancy
Liquid Calories, Snacks
Top Untracked Items
What an outside observer would notice
Reduced by 60%
Time spent on data entry/analysis
Increased by 5x
Client insight generation speed
Avg. 2-3 new patterns
Identified untracked items per client per week
The stack — build it yourself
Familiar to clients, easy for data export.
Excellent for identifying non-obvious patterns in unstructured text data like food diaries.
Centralised view for nutritionist, easy to customise and access key metrics.
These are the tools used in this story. Any can be swapped for an equivalent you already trust.
Go deeper
Do this yourself
Explore AI for your practice
This story runs on Done-for-you. The tools and prompts above are the real build — swap any tool for your own equivalent and follow the same steps.