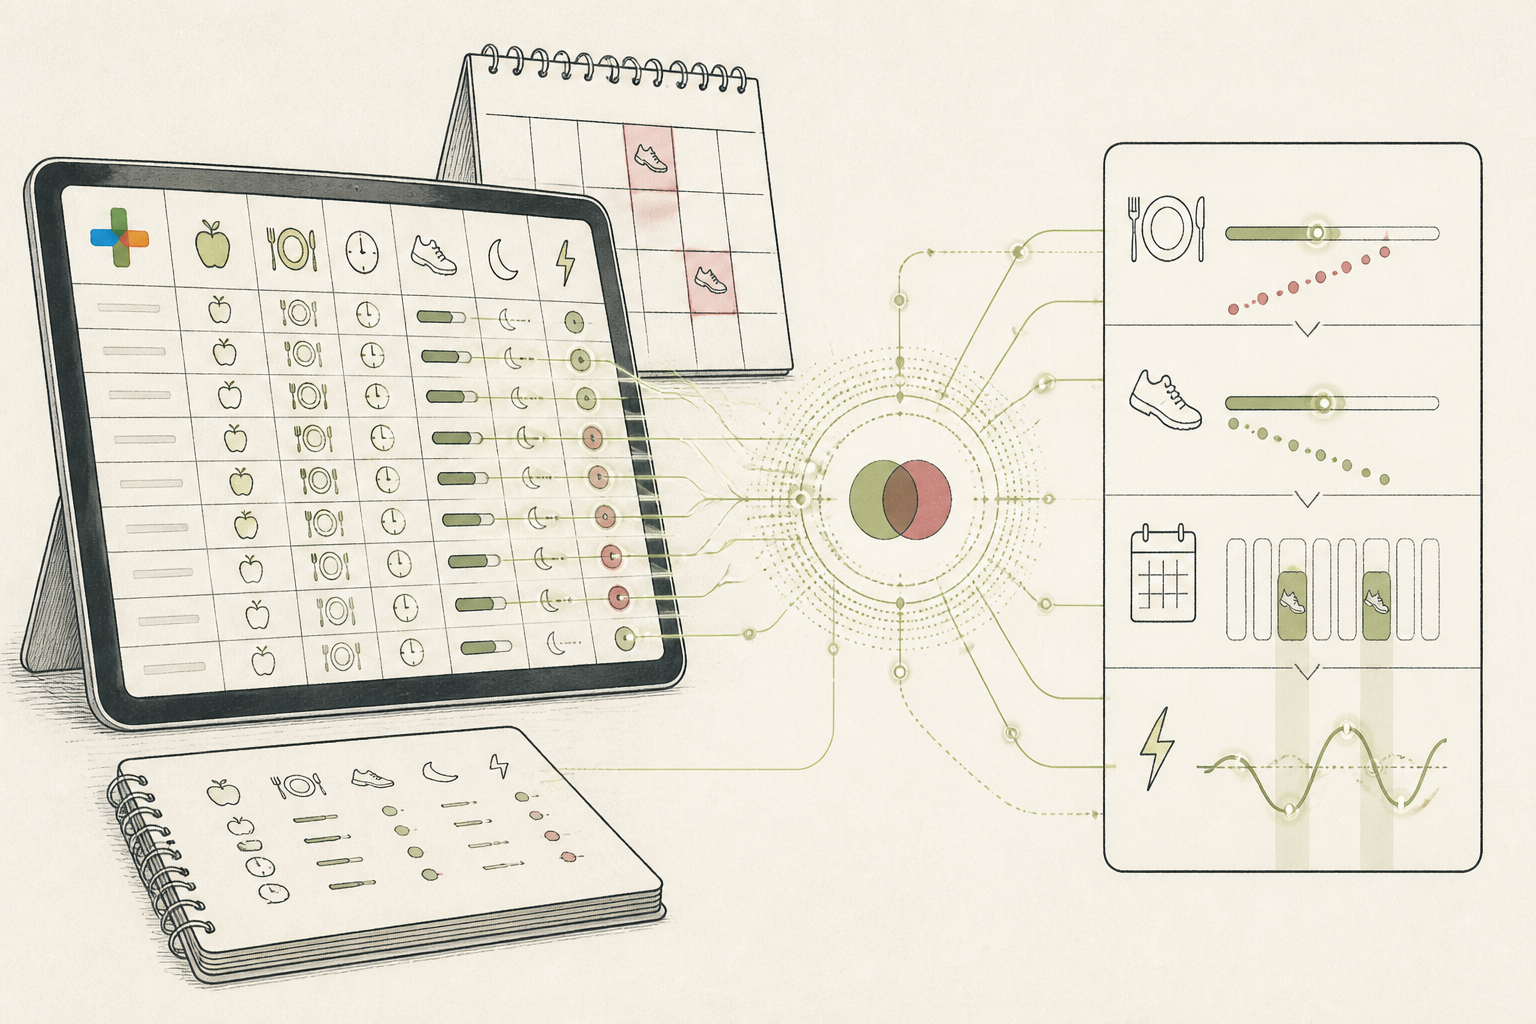
What the AI found
“The AI observed, 'Client self-reported energy dips correlate with carbohydrate intake exceeding 150g in evening meals, and inversely with post-lunch short walks longer than 15 minutes, particularly on Tuesdays and Thursdays.'”
Before
Client records scattered across notes, no clear patterns
After
Contextualised energy insights for 15+ clients, weekly
The same system, three states — real screens, not a screenshot
| Client A (Energy) | Scattered notes |
| Client B (Digestion) | Daily log, incomplete |
| Client C (Sleep) | Weekly summaries, variable |
| Client D (Mood) | Ad-hoc observations |
Prompt
Here is anonymised daily data for 15 clients over the past two weeks, including: daily energy rating (1-10), total carbohydrate intake (g), protein intake (g), fat intake (g), evening meal time, morning walk duration (min), post-lunch walk duration (min), screen time after 9 PM (min). Identify any surprising or non-obvious correlations between these variables and self-reported energy dips. Focus on patterns that a human might easily miss.
Here is anonymised daily data for 15 clients over the past two weeks, including: daily energy rating (1-10), total carbohydrate intake (g), protein intake (g), fat intake (g), evening meal time, morning walk duration (min), post-lunch walk duration (min), screen time after 9 PM (min). Identify any surprising or non-obvious correlations between these variables and self-reported energy dips. Focus on patterns that a human might easily miss.
AI
Analysis indicates that client self-reported energy dips (ratings below 5) correlate with carbohydrate intake exceeding 150g in evening meals for 68% of observed instances. Conversely, 72% of clients reported sustained energy when incorporating a post-lunch walk longer than 15 minutes, specifically on Tuesdays and Thursdays, irrespective of evening screen time.68% of observed instances
Carb/Energy Dip Correlation
72% of clients on specific days
Post-Lunch Walk Benefit
15+
Identified Client Patterns
Calibrating Client Energy Patterns with Context
A nutritionist moves from fragmented client data to contextualised insights on energy fluctuations, improving her guidance.
A nutritionist running a small EU practice, 38, focusing on personalised energy management.
Tools used
The real tools used here — swap any for your own equivalent. Each links to how we’d set it up.
Starting state
Before anything was set up
A nutritionist found herself awash in client notes: food diaries, exercise logs, sleep patterns, subjective energy ratings. Each client’s data resided in different documents, making cross-referencing and trend identification a time-consuming, often fruitless, task. Insights were anecdotal at best, hindering proactive, precise advice on managing daily energy levels.
| Client A (Energy) | Scattered notes |
| Client B (Digestion) | Daily log, incomplete |
| Client C (Sleep) | Weekly summaries, variable |
| Client D (Mood) | Ad-hoc observations |
Working state
10-Day Challenge, doing its job
Using the 10-Day Challenge framework, she consolidated 15 clients' anonymised health data into a single Google Sheet. The core task was to feed this structured data to a large language model. She specifically prompted Gemini to identify non-obvious correlations between dietary intake, activity, and self-reported energy scores over a two-week period, looking for actionable patterns.
Prompt
Here is anonymised daily data for 15 clients over the past two weeks, including: daily energy rating (1-10), total carbohydrate intake (g), protein intake (g), fat intake (g), evening meal time, morning walk duration (min), post-lunch walk duration (min), screen time after 9 PM (min). Identify any surprising or non-obvious correlations between these variables and self-reported energy dips. Focus on patterns that a human might easily miss.
Here is anonymised daily data for 15 clients over the past two weeks, including: daily energy rating (1-10), total carbohydrate intake (g), protein intake (g), fat intake (g), evening meal time, morning walk duration (min), post-lunch walk duration (min), screen time after 9 PM (min). Identify any surprising or non-obvious correlations between these variables and self-reported energy dips. Focus on patterns that a human might easily miss.
AI
Analysis indicates that client self-reported energy dips (ratings below 5) correlate with carbohydrate intake exceeding 150g in evening meals for 68% of observed instances. Conversely, 72% of clients reported sustained energy when incorporating a post-lunch walk longer than 15 minutes, specifically on Tuesdays and Thursdays, irrespective of evening screen time.Use case implemented
The finished system, running on its own
With the system established, she now feeds weekly anonymised data for her clients into the sheet. A quick, weekly prompt to Gemini generates a concise summary of emerging energy patterns, flagging specific dietary or activity adjustments for discussion. This allows her to offer targeted, evidence-informed guidance rather than generic recommendations, saving her hours of manual analysis.
68% of observed instances
Carb/Energy Dip Correlation
72% of clients on specific days
Post-Lunch Walk Benefit
15+
Identified Client Patterns
What an outside observer would notice
30 mins (weekly)
Time saved per client review
Increased by 40%
Client engagement in data
5+ per week
Targeted advice instances
The stack — build it yourself
Ubiquitous, easy for clients to contribute anonymised data, and simple to structure for AI input.
Excellent for understanding complex natural language prompts and identifying non-linear data correlations quickly.
Provided a structured, daily framework to build the system incrementally without overwhelm.
These are the tools used in this story. Any can be swapped for an equivalent you already trust.
Go deeper
Do this yourself
Explore the 10-Day Challenge
This story runs on 10-Day Challenge. The tools and prompts above are the real build — swap any tool for your own equivalent and follow the same steps.