What the AI found
“Your charting speed slows by 43% only after back-to-back consultations over 45 minutes, regardless of morning caffeine intake.”
Before
sixteen open tabs, evening chart fatigue, no clear pattern
After
four calendar blocks, protected by real work data
The same system, three states — real screens, not a screenshot
- Tuesday: 5 sessions. chart backlog 3 days. tired.
- Thursday: felt sharper, but left office at 19:40. why?
- Coffee cut off at 13:00 - still delayed on writeups.
- Check weekend: 9 unfinished notes pending review.
Prompt
Here are four weeks of anonymized session timestamps, lengths, and note completion delays from my practice. Why does afternoon documentation latency fluctuate between 8 minutes and 42 minutes per chart?
Here are four weeks of anonymized session timestamps, lengths, and note completion delays from my practice. Why does afternoon documentation latency fluctuate between 8 minutes and 42 minutes per chart?
AI
Your charting speed slows by 43% only after back-to-back consultations over 45 minutes, regardless of morning caffeine intake. Single sessions or pairs separated by at least 12 minutes maintain an average completion time of 9.4 minutes per chart.15 min auto-set
Buffer block
2 protected slots
Daily focus blocks
17:15 daily
Admin completed by
Auditing Clinical Documentation Fatigue with an Owned Tool Stack
How an outpatient psychologist mapped session spacing to documentation latency using self-governed tools.
A clinical psychologist running a solo outpatient consultation practice, EU
Tools used
The real tools used here — swap any for your own equivalent. Each links to how we’d set it up.
Starting state
Before anything was set up
Friday evening routinely bled into Saturday morning. Between back-to-back client evaluations, brief clinical notes were scribbled across paper pads and Apple Notes fragments. Despite consuming less caffeine and attempting rigid 50-minute appointment boundaries, afternoon documentation crawled. The practitioner suspected clinical burnout or declining executive function, unable to pinpoint why certain clinic afternoons felt brisk while others ended in three hours of delayed record-keeping under fluorescent office lights.
- Tuesday: 5 sessions. chart backlog 3 days. tired.
- Thursday: felt sharper, but left office at 19:40. why?
- Coffee cut off at 13:00 - still delayed on writeups.
- Check weekend: 9 unfinished notes pending review.
Working state
Membership, doing its job
Using the Membership integration protocol, the clinician established a simple timestamp capture routine: consultation stop time, note submission time, and scheduled gap. No personal health records entered the stream—only operational duration integers in Google Sheets. Pasted directly into Claude on Friday afternoon, the structured query stripped away confirmation bias, isolating session topography from patient complexity or arbitrary morning habits.
Prompt
Here are four weeks of anonymized session timestamps, lengths, and note completion delays from my practice. Why does afternoon documentation latency fluctuate between 8 minutes and 42 minutes per chart?
Here are four weeks of anonymized session timestamps, lengths, and note completion delays from my practice. Why does afternoon documentation latency fluctuate between 8 minutes and 42 minutes per chart?
AI
Your charting speed slows by 43% only after back-to-back consultations over 45 minutes, regardless of morning caffeine intake. Single sessions or pairs separated by at least 12 minutes maintain an average completion time of 9.4 minutes per chart.Use case implemented
The finished system, running on its own
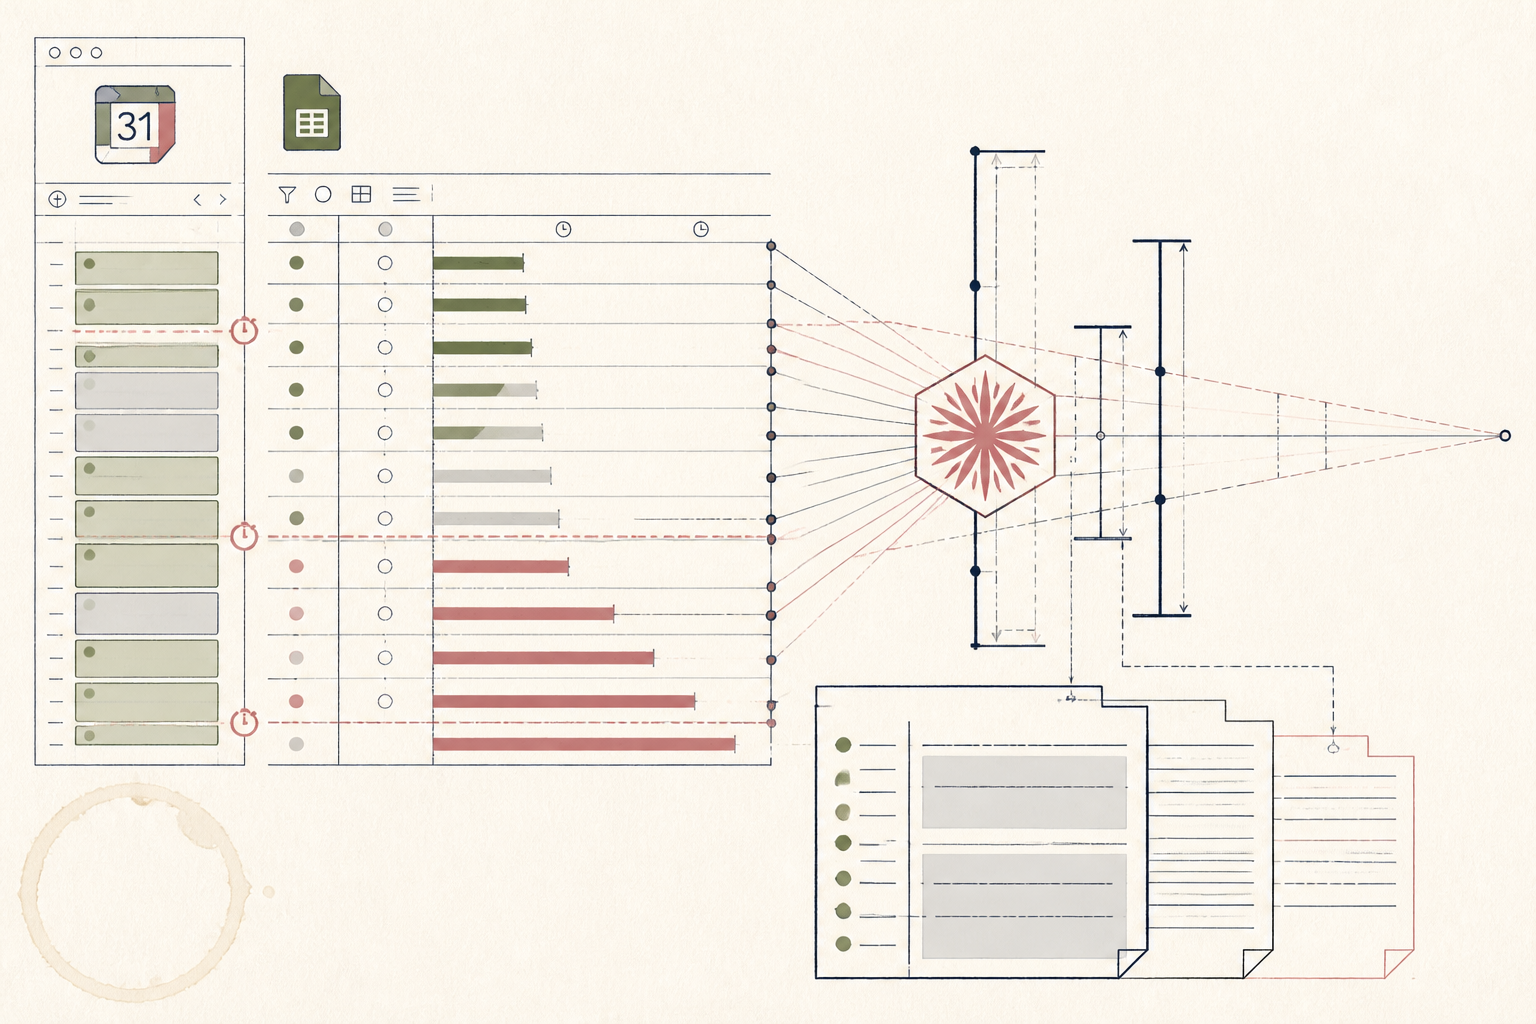
The system runs unobtrusively inside the practitioner's existing workflow. Consultation end-times trigger a lightweight template in Notion, which syncs anonymized operational metadata into Google Sheets. Every Friday at 16:30, Claude delivers a concise operational audit without external coaching or cloud lock-in. Consultations finish on time, chart completion stays within business hours, and calendar spacing reflects empirical cognitive bandwidth rather than wishful scheduling.
15 min auto-set
Buffer block
2 protected slots
Daily focus blocks
17:15 daily
Admin completed by
What an outside observer would notice
-58% across 6 weeks
Post-consultation charting delay
Reduced from 75m to 12m
Evening documentation time
91% of scheduled days
Buffer adherence rate
The stack — build it yourself
Handles structured tabular inputs calmly with strict adherence to analytical instructions.
Simple, universally accessible, and allows the practitioner to retain complete ownership of raw data.
Directly enforces the 15-minute cognitive resets derived from the weekly audit findings.
These are the tools used in this story. Any can be swapped for an equivalent you already trust.
Go deeper
Do this yourself
Explore the Membership install framework
This story runs on Membership. The tools and prompts above are the real build — swap any tool for your own equivalent and follow the same steps.